

How to trade XAUUSD | Spot Gold vs Dollar with 100% accuracy?
Some say that gold is one of the most difficult markets to trade and there is some truth to that – gold doesn’t move like other markets and if investors want to be successful in trading it (and it can be very rewarding), they have to keep several things in mind. Over the years of monitoring and analyzing the gold market we noticed many profitable rules and patterns. We successfully applied them and are still applying them for our precious metals trades.
- Gold has a huge daily range. Daily ranges of 400-800 pips are not uncommon and the average “small” day is 3000 pips.
- Gold is volatile: Gold can easily swing 60-300 pips within minutes. Large reversals are common. An order that looks very good can turn into a loser quickly and an order in draw-down can also go into profit very quickly. The speed by which the market can move and change direction requires very good pre-planning or very quick decision making. If you wait too long to see if price will reverse after touching an s/r, you can lose most of your gain. Then again, many times, it blows right through the s/r after a short pause making your win bigger.
- Split Personality: Gold also can move a very big distance without looking back. Although pauses are made at important s/r, pullbacks on the best moves simply do not occur. It is difficult to tell when gold is “swinging” and when it is “running” until you see the actual moves
- Gold Respects S/R EXTREMELY well: This is a wonderful feature. Gold can be technically traded accurately and consistently from this aspect. Pivots, manually placed horizontal s/r and trendlines, and Fibs are very well respected
- Waiting for candle close is MANDATORY for decisions, especially entry: Price can reverse a long distance in the last few minutes of an hourly candle, a ½ hour candle and certainly a 4-hour candle. Jumping into a trade you “think” is going to close through a certain point can burn you badly.
- Reversal Candlestick Formations Are Extremely Accurate: By combining this plus a bounce off of s/r after a move in one direction, REGARDLESS of overall trend, usually results in a move of some distance, usually back to the next s/r at least. Higher timeframe, the better the move.
- Gold Trades Well Most of the Day: Really the only time gold doesn’t move very well is the last couple hours of NY session and first couple hours of Asian session. By time Tokyo opens, gold can be traded. Moves during Asian session are smaller than London, and London moves tend to be smaller than NY moves. Biggest moves occur when both London and NY are open.
- Price Action Dominates: The best indicator I have found for subsequent moves is simply price action. If gold moves strong through or off of an area, particularly after a period of “quiet” price action, the resulting moves are very consistent.
- Gold Can PUNISH Bad Trading: Oh boy, if you aren’t 100% good at identifying proper areas or the moves around them, gold can make you lose quickly and in both directions. Common mistakes like “shooting from the hip” by taking gut moves, or “revenge trading” which can usually be rectified after you calm down in forex, are usually too late to do anything about with gold. You need a plan, and HAVE to stick to it to even have a hope of success.
- Keep the sizes of your gold, silver and mining stock trading positions small. The higher the chance of being correct, the bigger the position can be (that’s why sizes of long-term investments are bigger than sizes of short-term trades).
- Pay attention to cycles and turning points – many markets have cyclical nature (for instance the USD Index and silver) and cycles can be a great help in the case of short- and long-term trades.
- Check the efficiency of each indicator that you want to use on the gold market (or other markets) before applying it and trading real capital based on it.
- Consider using RSI and Stochastic indicators for gold, silver and mining stocks as they have proven to be useful over many years. Other indicators can be useful as well, but be sure that you examine them before you decide to make trading decisions based on them.
- If a given indicator works “almost as well” as you’d like it, but you see that it has potential, don’t be afraid to modify it. For example in case of RSI, you see good selling opportunities when this indicator moves to 65 or so instead of the classic 70 level) then it can be useful and profitable to either add additional overbought / oversold level, breaking which would generate a signal (in this case a sell signal) or to change the parameters of the indicator, deviating from the standard values.
- Use moving averages only if they have been working for a given market in the past – if a given market has been ignoring a certain moving average, most likely so can you.
- Keep track of the price seasonality – in our opinion its best to use True Seasonals as expiration of derivatives can also have an important impact on the price of gold, but if you can’t get access to them, it’s better to use regular seasonality than none at all.
- Use trend lines and trend channels – they have often proven useful as support and resistance lines / levels in the case of gold, silver and mining stocks. The more significant lows or highs are used for creating a given trend line or channel, the stronger the support or resistance is.
- The previous highs and lows can and often serve as support/ resistance levels as well – in the case of the precious metals market, the strength of the support / resistance is strength of the support / resistance created as rising or declining trend lines. The more significant the high or low is, the stronger the resistance or support.
- Note that markets have not only a cyclical nature, but a fractal one, too. The rallies and declines are self-similar, which means that price patterns that we saw on a bigger scale are quite likely to be seen on a smaller scale (proportionately). This observation can be of great help when determining how low or how high gold, silver or mining stocks will move.
- Pay attention to volume. The volume is a very important, yet often overlooked, piece of information. If a rally is accompanied by rising volume, then it’s likely a start of an even bigger rally. If a rally is accompanied by low or visibly declining volume, then it’s likely ending. If a decline is accompanied by high or rising volume (unless there is a day when the price visibly reverses), then the decline is likely to continue. If a decline is accompanied by low volume, then there are no meaningful implications (yes, the situation is not symmetrical in this case). The above are general guidelines, and before applying them to the current market situation, be sure to check if the above (the part of the above that currently represents the situation on the market) really worked in the way above – if it didn’t, then it’s generally better to expect the same type of reaction that previously accompanied a certain price/volume pattern.
- Look for price formations (like a head and shoulders formation), but before you apply them (believe that a certain formation is “in play” and likely to cause a certain move which would cause you to enter or close a given trade) be sure to check if this kind of formation worked on this market previously. For instance “breakouts” (which are not a formation by themselves, but this example illustrates what we mean) in silver have quite often resulted in price declines (breakouts were invalidated) instead of rallies, so their real implications were the opposite of what one might have expected based on the classic definition of a breakout.
- Wait for confirmations. It’s usually best to wait for breakouts / breakdowns confirmation before taking action. In the case of the precious metals market, based on our experience, it’s worth waiting for three consecutive closing prices below / above the critical price level before viewing the breakout / breakdown as “confirmed” and thus meaningful. Invalidation of a breakout is a bearish sign and invalidation of a breakdown is a bullish sign.
- Analyze more than the market in which you want to trade. In today’s global economy no market can move totally independently. Gold and the rest of the precious metals sector are no exception – their price moves are often linked to the moves on the currency market, moves on the general stock market, interest rates, Fed’s comments, and performance of gold stocks and silver stocks are just the most important ones. Be sure to check what markets were moving in tune or in the opposite direction to gold before and make sure that their impact is likely to be supportive of the trading position that you are about to open. For example, if gold was moving in the exact opposite to the USD Index and you’re considering opening a long position – if you see that the USD Index is very close to a major resistance level and it’s already heavily overbought, then the odds are that the USD Index will top and contribute to or even trigger gold’s decline.
- Analyze ratios. Of course, not just any ratios – the ratios that have proven to provide important signals for gold (like the gold stocks to gold ratio or gold to silver ratio – they both have a history of leading gold, but this has not been the case during the post-2011 decline), that are important due to fundamental factors (gold vs. bonds ratio – both can be seen as safe-haven assets and major bottoms and tops in this ratio take place along with major tops and bottoms in gold, so it can be used as a confirmation) or because they are often discussed (gold to oil ratio). Sometimes ratios can be utilized to see something from a non-USD perspective (gold to UDN ratio is the weighted average of gold priced in currencies other than the US dollar, with weights as in the USD Index – this ratio can be used to confirm major moves in gold or suggest that these moves are just temporary as they are only visible from the USD perspective).
- Analyze other time-frames than the one that you’re focusing on. Even if you are placing a short-term trade, be sure to check the medium- and long-term trend. Generally, the longer the time frame, the stronger the support and resistance levels, so even if you analyzed the short-term picture, it can be the case that a given move will be stopped by a medium- or long-term resistance. If you’re focusing on the medium- or long-term trades, the short-term picture can help you fine-tune the moment of entering or exiting the market.
- Be on the constant lookout for anomalies. When you see something odd, investigate and find the reason behind it and check if anything similar happened previously – if yes, check what happened next. If similar things were always followed by the same kind of price pattern in gold, silver and/or mining stocks, it might be a good idea to trade it. If not, then perhaps the reason behind the anomaly resulted in something else that had a more specific effect on the precious metals prices.
- Monitor investor sentiment. If the vast majority (!) of precious metals investors and traders are bullish, then gold is likely close to a top (in this case it makes sense to look for selling signals and / or confirmations that the top is in and – if they are present – exit long positions and / or enter short ones). Conversely, if everyone and their brother is bearish on the market, then a bottom is very likely close to being in or already in. The ways to estimate sentiment include checking how often people look for gold-related terms (like “gold stocks”) in Google Trends, monitoring outcomes of surveys with questions like “where will gold price be in 3 months” and similar queries, and also checking the traffic of gold-related websites on Alexa. On a side note when you see that a certain, big gold-related website is very slow or crashes after a big move up or down, then it likely means that the traffic / interest in gold was enormous, which is another way of detecting that a major price extreme is well-nigh (we saw that in 2011 when gold topped).
- Even if your primary approach is to trade gold, we still encourage you to consider dedicating a part of the capital to long-term investments – it should lower the overall variability of your returns and making gains more stable. There are also other benefits that we outlined in our very first report in which we discussed whether trading gold or investing in it is more profitable. Our gold portfolio report includes a sample portfolio for “Trader John”, which might serve as an example (of course, it’s not investment advice) of how traders could structure their portfolios and benefit from diversified strategies.
- Before you decide to follow an analyst, be sure to check how long they have been in the business and if they are known for their good performance. Check our performance here.
- GOLD TRADING IS NOT FOR BEGINNERS!
- IF YOU ARE STRUGGLING AT FOREX, GOLD WILL EAT YOUR LUNCH
- IF YOU ARE NOT DISCIPLINED AND STRUCTURED CONSISTENTLY, GOLD WILL RUIN YOUR ACCOUNT
Tools for Analyzing Gold
When gold prices rise and fall, there are tools that aid in determining how strong the trend is. This aids in making decisions for mining company stocks and gold or gold ETFs.
Here are several key things to look for in a strong gold uptrend:
- The price of gold is starting to rise or is in an uptrend.
- The gold mining stocks, as measured by a gold miner’s index like the Vaneck Vectors Gold Miners ETF (GDX), is rising at a faster pace than gold.
- Junior gold miners, as measured by an index like the Vaneck Vectors Junior Gold Miners ETF (GDXJ), is rising faster than GDX. In other words, the small companies are rising quicker than the larger more established mining companies.
The same concepts apply to downtrends in gold, except we reverse the expectations. In a weak gold market, the price of gold is falling, the gold miner are falling more than gold (percentage terms), and the juniors are declining even more than the larger miners. In this article, we will focus on the uptrend, as most investors are looking to buy gold, and avoid the downtrends.
Regarding the first point, gold and the mining stocks tend to move together. Although, the stocks often make the first move. For example, if gold prices are stagnant it is usually the stocks that start to rise first, followed by gold.
Once gold and the stocks are rising, this is favorable for both gold and the mining stocks. Gold should start making higher swing lows and higher swing highs. This is the definition of an uptrend.
Check My Trading Performances in XAUUSD for your reference: | Check On MyFxBook.com – Real ECN Accounts:
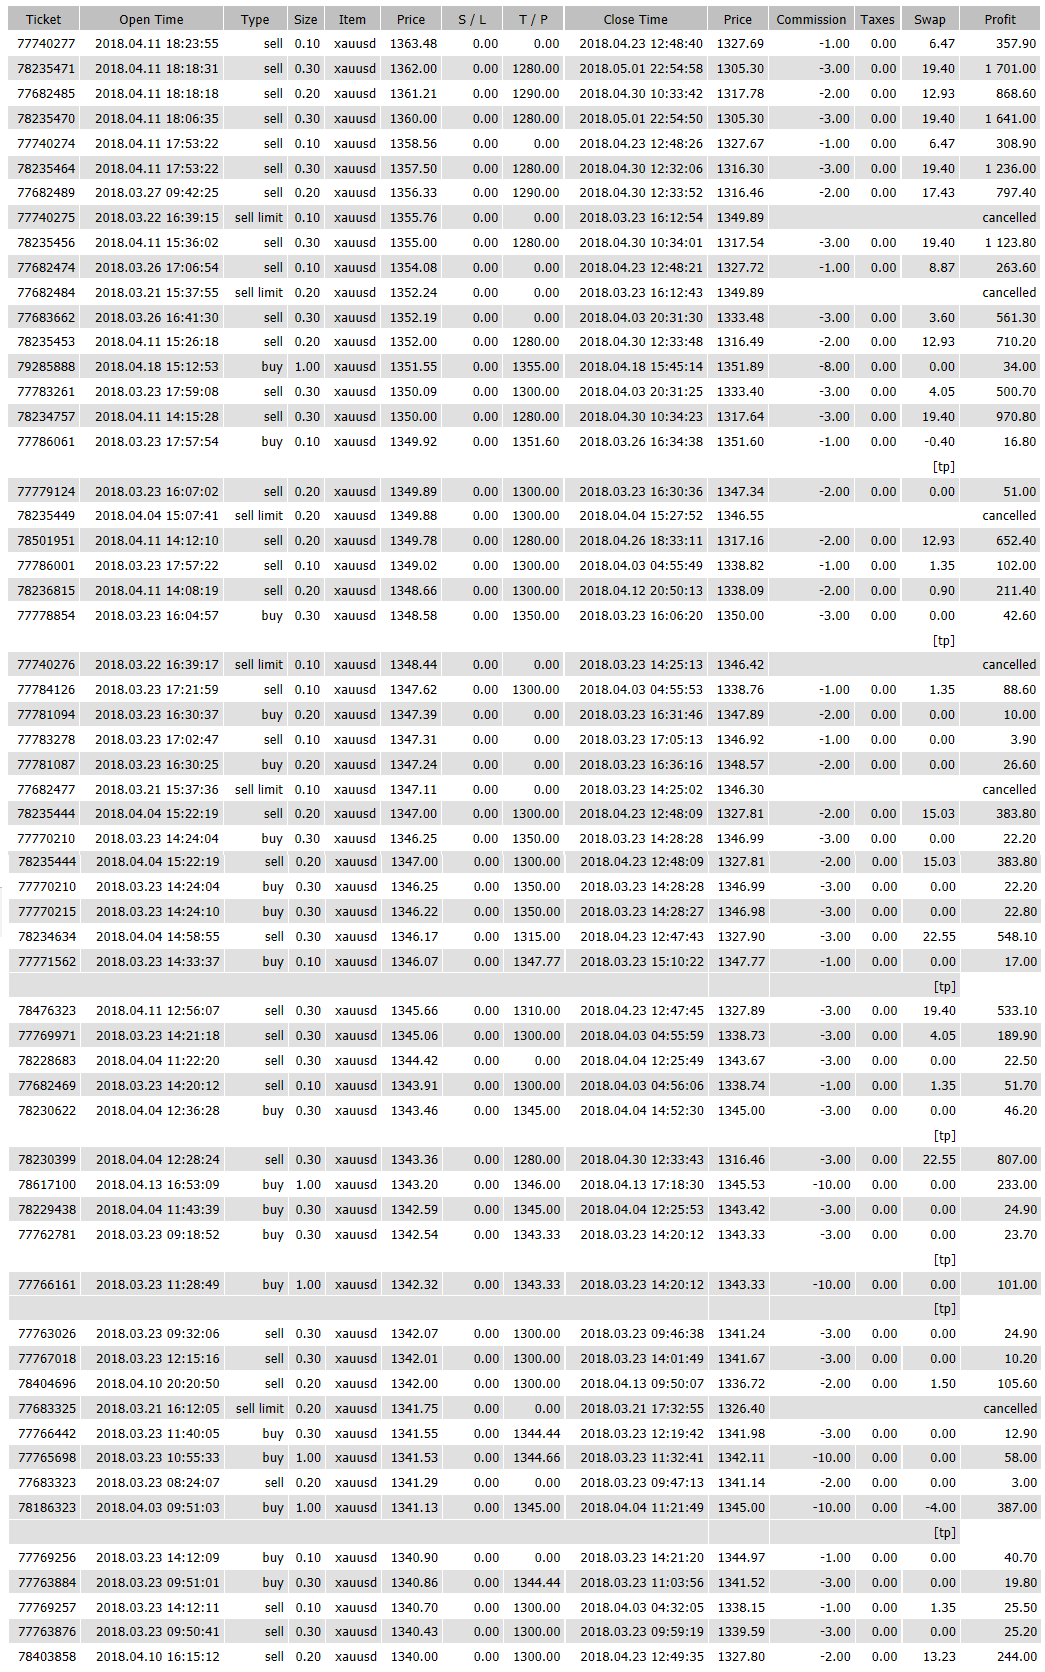
Click This Link To Check our Trading Performances with 100% accuracy on MyFxBook.com
For more details, Portfolio Management in Forex & Commodity Trading, please email at piyushratnu@gmail.com