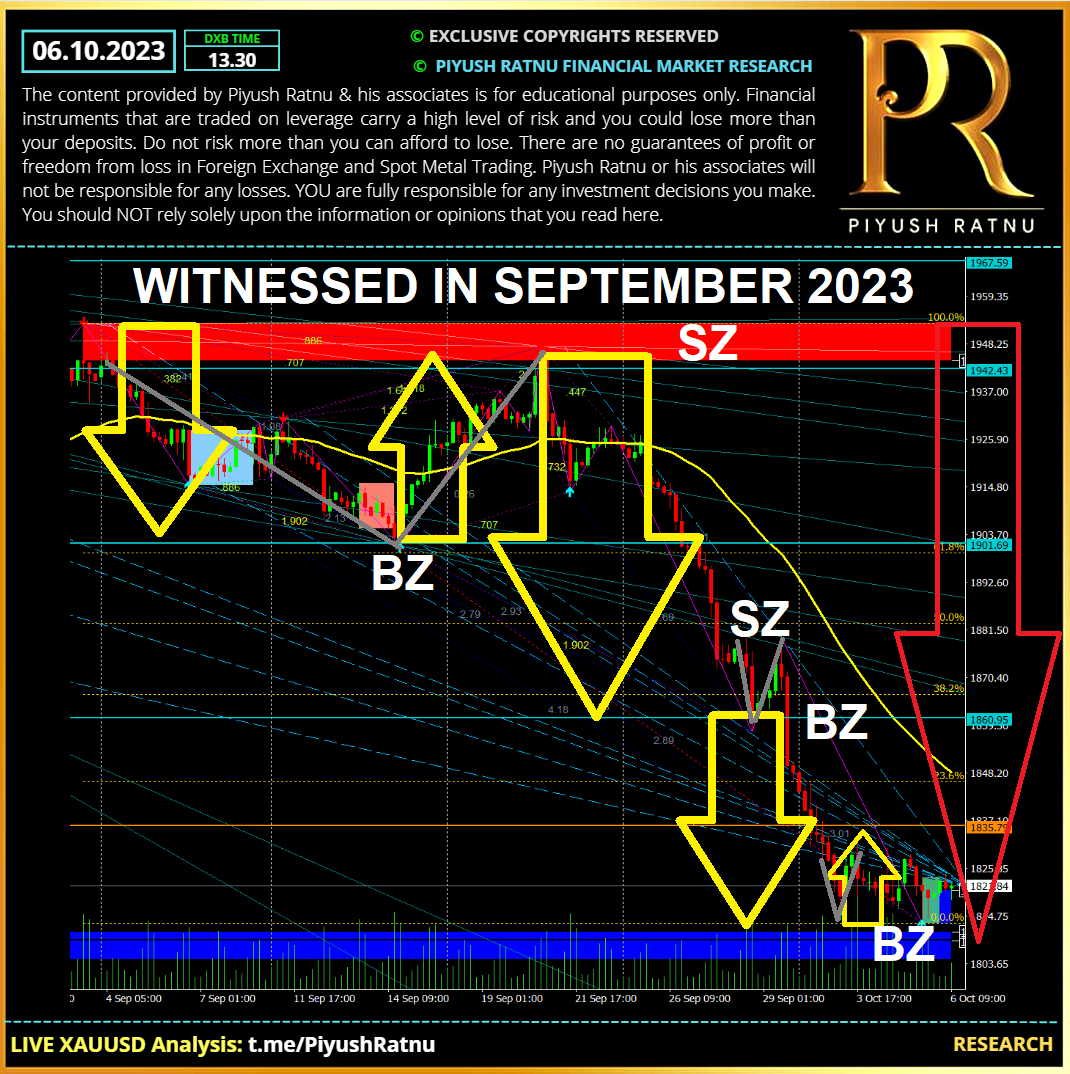
As projected in my analysis dated 01.09.2023: If the bearish momentum extends, Spot Gold price may fall further towards $1907/1888/1866/1836 price trap zone as next stops, if Gold crash halts at $1866 or $1836 zones a reversal can be expected with a RT V 23.6 M15 M30 RT before/in next 12 trading days.
Buying zones projected in September 2023 analysis:
S2 ZONE $1888 | DOWN TREND (Below $1907) : 1900/1888/1866/1836 | BUY LIMITS
As projected in my analysis: dated 01.09.2023: I had projected crash in Gold price of Gold smashes $1907 support zone. Buy limits at 1888, 1866, 1836 were suggested by me with exit of $5/NAP. Those who implemented buy limits and made an exit in NAP: am sure made a good profit and neat exit.
XAUUSD PRICE ACTION with NAP exits witnessed in September 2023:
$1907 Buying Zone: $1912-1904 RT $1909 witnessed on 26.09.2023
$1888 Buying Zone: $1888-1857 RT $1880 witnessed on 29.09.2023
$1836 Buying Zone: $1840-1830 RT $1840 witnessed in 02.10.2023
$1818 Buying Zone: $1830-1816 RT $1828 witnessed on 04.10.2023
$1907 Buying Zone: $1822-1813 RT $1823 witnessed on 06.10.2023
In all the above price movements, price zones projected by me proved accurate and an ideal buying zone to exit in NAP.
Summary:
A downward price movement of $140/ 14000 pips ($1953 – $1813) and upward price movement of $45/4500 pips ($1902-1947) was observed during mid-September 2023. Selling Highs and Buying LOWS in September 2023 once again proved a correct trading strategy at our projected buying and selling price zones, as witnessed and implemented in last 3 years, selling at and above $1947 after completion of V pattern gave us handsome results.

I always prefer to BUY lows at my BUY zones traced through the tools displayed in the images in case of price crash, and this strategy has given neat results so far since 2016. CMP $1821.
Read NFP Day Analysis dated 01.09.2023 here:
