Analysis 08.07.2022 Review:
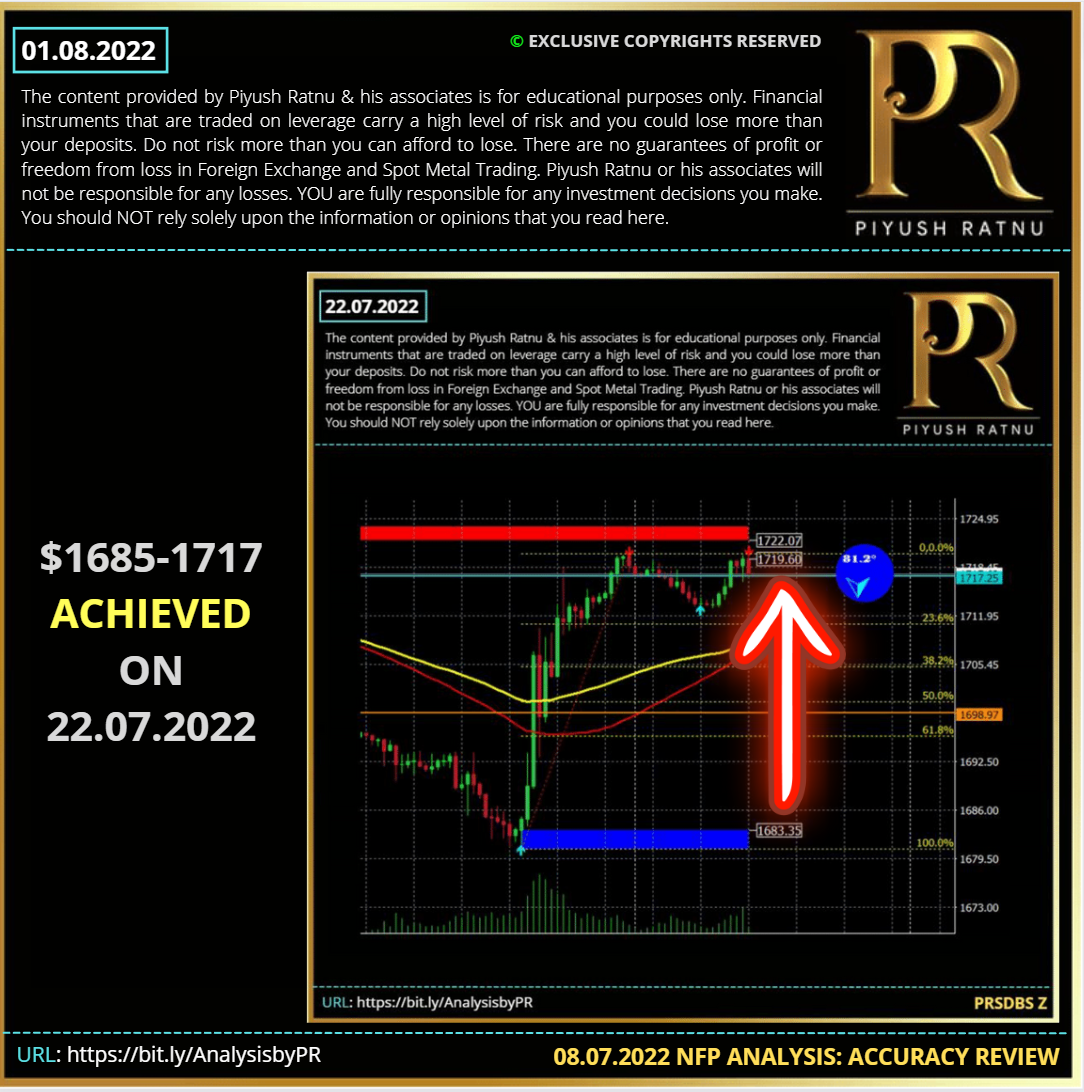
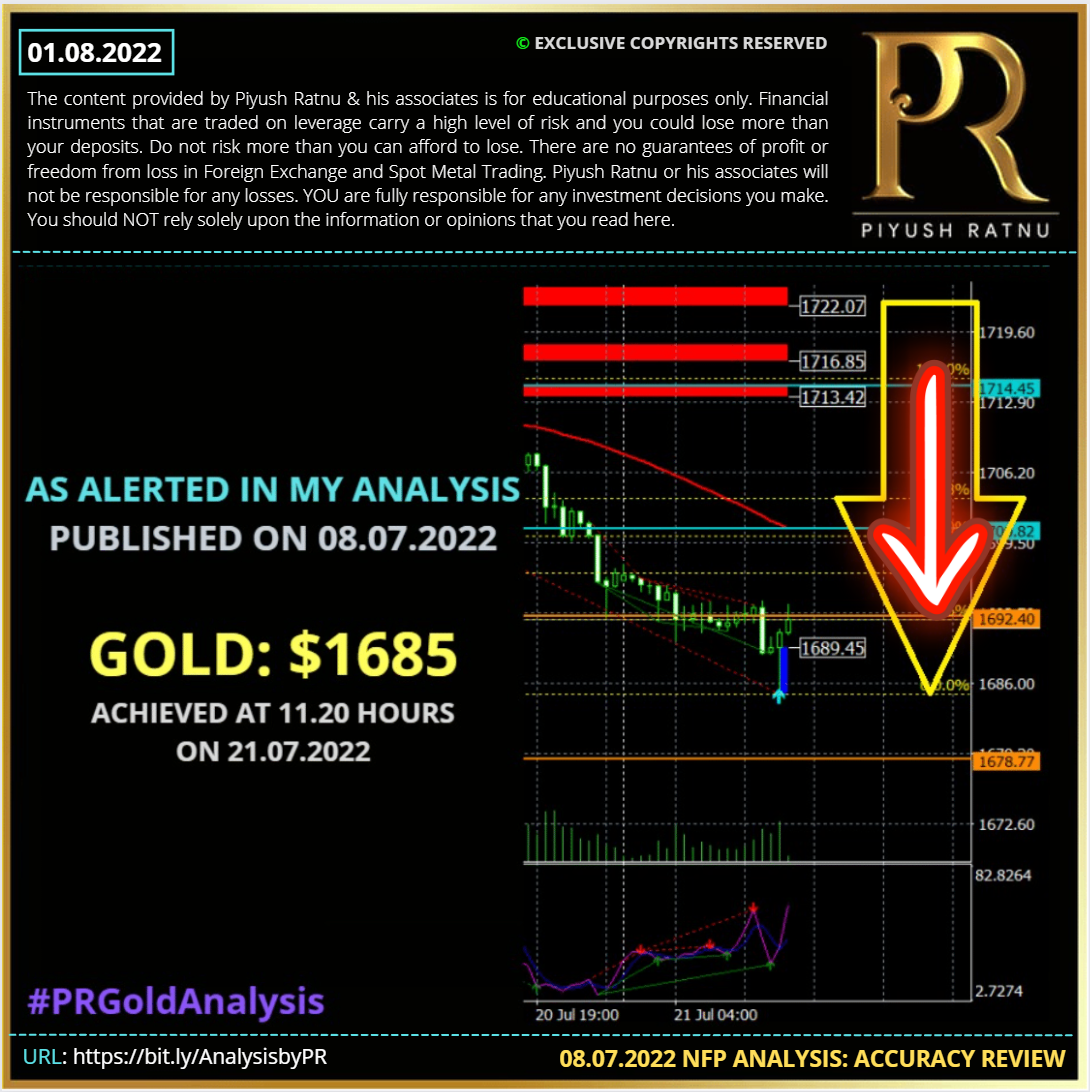
Buying and Selling Spot Gold (XAUUSD) at the key price entry levels mentioned in my analysis dated 08.07.2022 with a target of net average profit in each set: in last 30 days gave good results: ($) Sell: 1808, 1777 | Buy: 1735, 1717, 1685. | XAUUSD CMP $1790
BUY/SELL STOPS | BUY/SELL LIMITS: TARGET NAP ( Net Average Profit):
S4 ZONE 1717 | DOWN TREND (Below 1721): 1717/1685/1666/1636 BUY LIMITS
R2 ZONE 1750| UP TREND (After 1758) : 1777/1808/1818 SELL LIMITS
On 21 July, 2022: Gold crashed till $1680, and immediately reversed to $1717 in next 48 hours. Yesterday: XAUUSD touched the mark of 1794, after reversing back to and from $1777.
Result: Gold touched the mark of 1735-1717-1685 by 21 July, 2022 and retraced till $1777/1790 zone before August NFP data day.
Read July NFP Day: 08.07.2022 analysis HERE. Analysis Review: Check here.
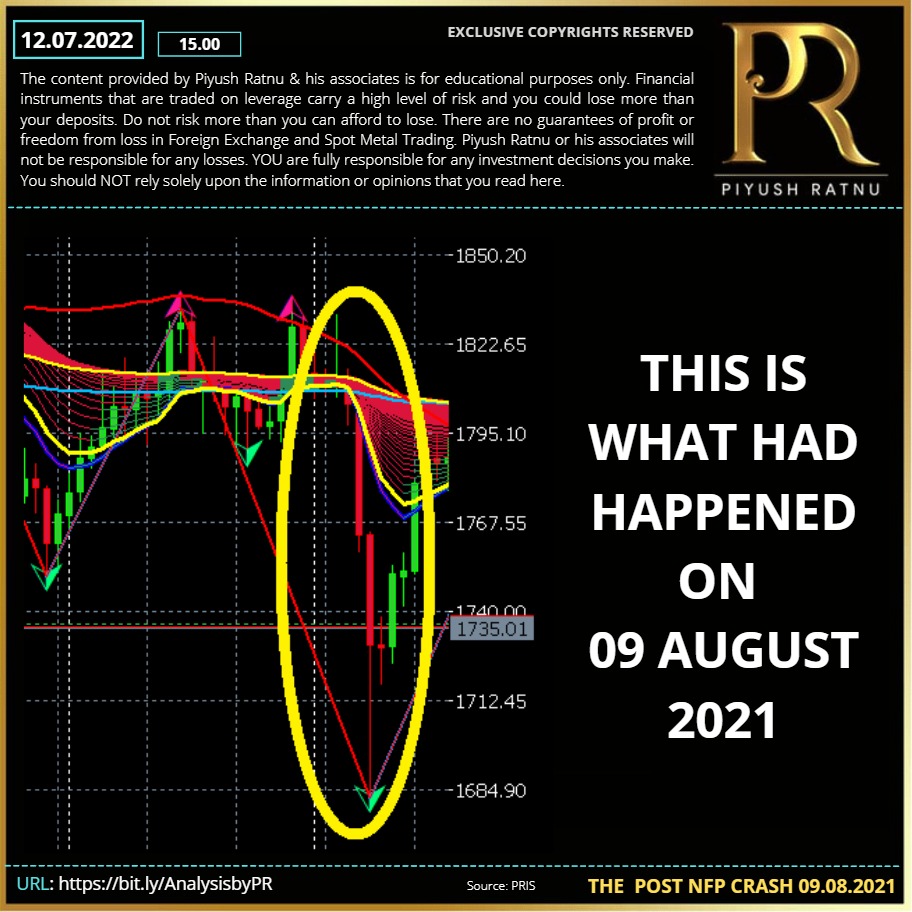
The Ugly Price Crash of 09 August 2021:
I am sure all the Gold traders including me, will never forget the early trading hours of 09 August 2021, when Gold price was (supposedly) pushed from $1756 to $1685 in four trading hours by few traders associated with one of the top banks of the world, who are now under investigation for the same (trial in process). However, in July 2022 – the same levels were observed wherein Gold price crashed from $1836 till $1685 (21 July, 2022 low) and I alerted the zone of $1685 in advance in my analysis dated 08.07.2022.
As reported by Reuters, Prosecutors say the goal of the scheme was spoofing, a manipulative tactic to place and then quickly cancel buy or sell orders to create the illusion of demand or supply and then profit from the price movement.
Michael Nowak, former JPMorgan precious metals trader Gregg Smith and salesperson Jeffrey Ruffo are on trial together on charges of conspiracy and racketeering for an alleged scheme to manipulate precious metals futures between 2008 and 2016.
The bank’s former global precious metals desk head Michael Nowak, precious metals trader Gregg Smith and salesperson Jeffrey Ruffo are accused of conspiring to defraud market participants via a manipulative trading tactic known as spoofing.
Former JPMorgan metals traders Christian Trunz and John Edmonds were key witnesses at trial. Both pleaded guilty to related charges and cooperated against their former colleagues. (As reported by Reuters).
Fundamental Analysis | XAUUSD CMP $1790| 05.08.2022
Key Points:
- Gold demand softened in Q2: Despite Q2 weakness, strong first quarter ETF inflows fuelled a notable H1 recovery. Gold demand (excluding OTC) was 8% lower y-o-y at 948t. Combined with Q1 this took H1 demand to 2,189t, up 12% y-o-y. As the gold price fell in Q2, gold ETFs lost 39t, giving back some of the strong Q1 gains. Net H1 inflows totalled 234t compared with 127t of outflows in H1’21.
- Gold prices are currently holding above $1777 after the interest rate hike, however the bullish momentum does not seem sustainable as no significant increase has been made so far in the buying volume, except US-China tensions based price movement.
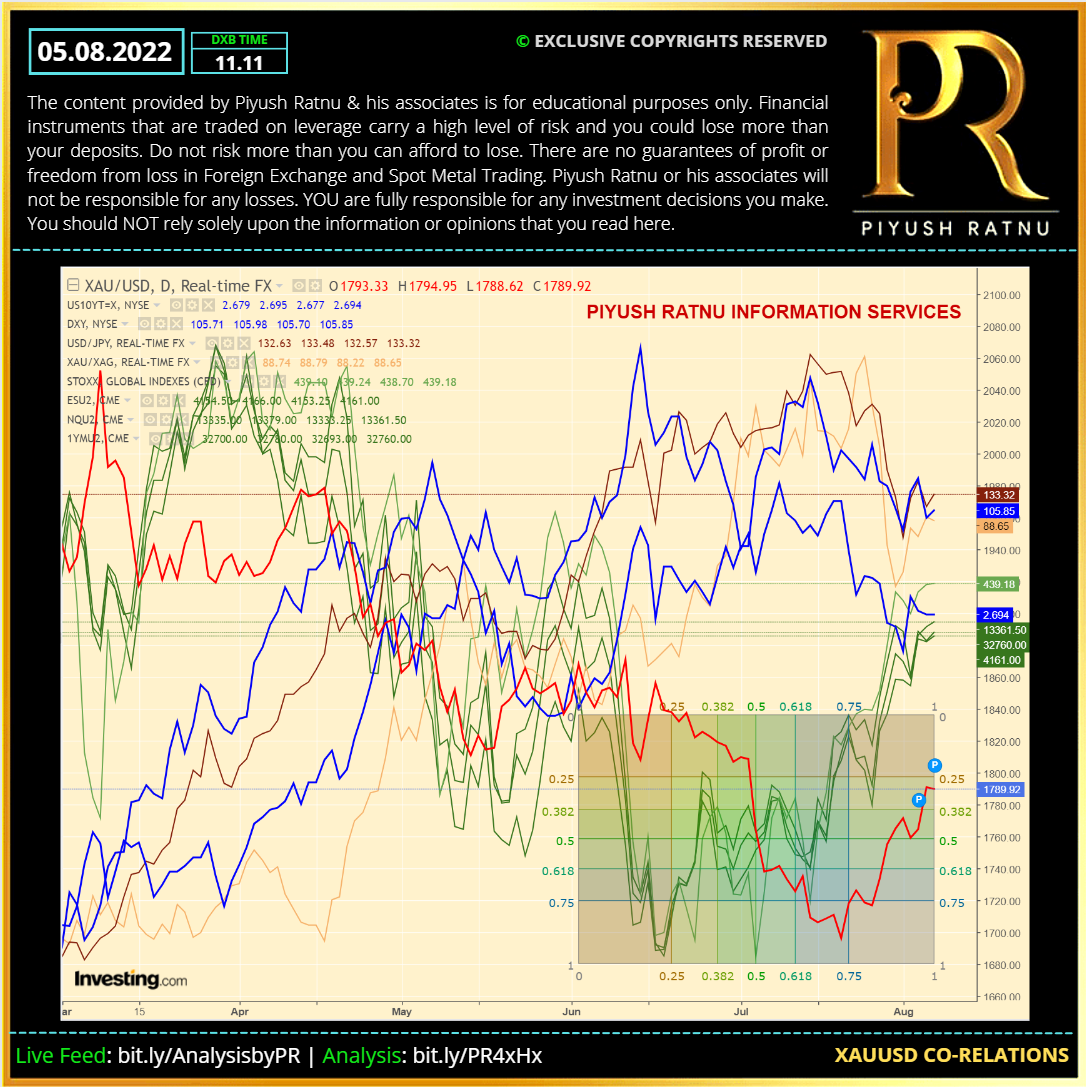
- Dollar Index is holding 105.800 zone, US 10YT at 2.686, XAUXAG ratio at 88.57 and USDJPY is struggling at 133.00 zone.
The Pelosi Drama: Gold price remains side lined within a choppy trading range
After the peaceful visit of Pelosi, the hype of uncertainty crashed resulting in price retracement till $1755 zone (03.08.2022), further momentum and economic data pushed Gold price towards $1794. Amidst mounting recession risks, especially after the Bank of England (BOE) projected one later this year, markets witnessed a temporary safe-haven bid in the US dollar but dismal weekly Jobless Claims data dragged the buck lower. The US Labor Department said that initial claims for state unemployment increased by 6,000 to 260,000 in the week ending on July 30, hovering near an eight-month high. Markets forecast that a sustained rise in the numbers could hint at a potential recession for the world’s largest economy. Demand for safe havens jacked up and investors sought refuge in the traditional safety bet gold.
Gold prices remain side lined but the negatives are more than the positives and hence today’s US employment report for July will be crucial for near-term directions. Should the employment data appear stronger, the US dollar rebound can extend and weigh on gold prices.
Technical Recession: A myth or fact?
According to the initial measure of the Bureau of Economic Analysis, real GDP dropped 0.9% in the second quarter, following a 1.6% decline in the first quarter (annualized quarterly rates). As the chart below shows, on a quarter-on-quarter basis, real GDP decreased by 0.4 and 0.2 percent, respectively. Thus, the US economy recorded two quarters of negative growth, which implies a technical recession.
Though officials are denying it! President Biden said last week: “We’re not going to be in a recession, in my view.” Similarly, Treasury Secretary Janet Yellen said that the US economy is not in a recession, instead it’s “in a period of transition in which growth is slowing”. Not to forget, these are the same guys who were claiming that high inflation would be only transitory, and here we are facing the inflation heat at it’s peak. Since the monetary policy operates with a lag, so the worst is yet to come.
To be clear, it’s too early to announce a new bull trend in gold. Gold needs a scary recession numbers or an economic catalyst that might trigger a lot of fear and uncertainty resulting in the Fed to ease its monetary stance. Let us be prepared for the gold to decline substantially before it starts its new upwards rally. In my opinion, the last FOMC meeting reduced the odds of a large decline, but the sell-off at the beginning of a crisis phase is still very likely, as it was observed in 2008 and in 2020.
The NFP report is expected to show that the US economy added 250K jobs in July, down from 372K in the last month. The unemployment rate, however, is expected to hold steady at 3.6% during the reported month. The data would influence the near-term USD price dynamics, which, along with the broader risk sentiment, should provide direction to the gold price. The lack of any meaningful buying interest, however, suggests that the near-term bearish trend might still be far from being over hinting the price zone of $1717/$1666 ahead.
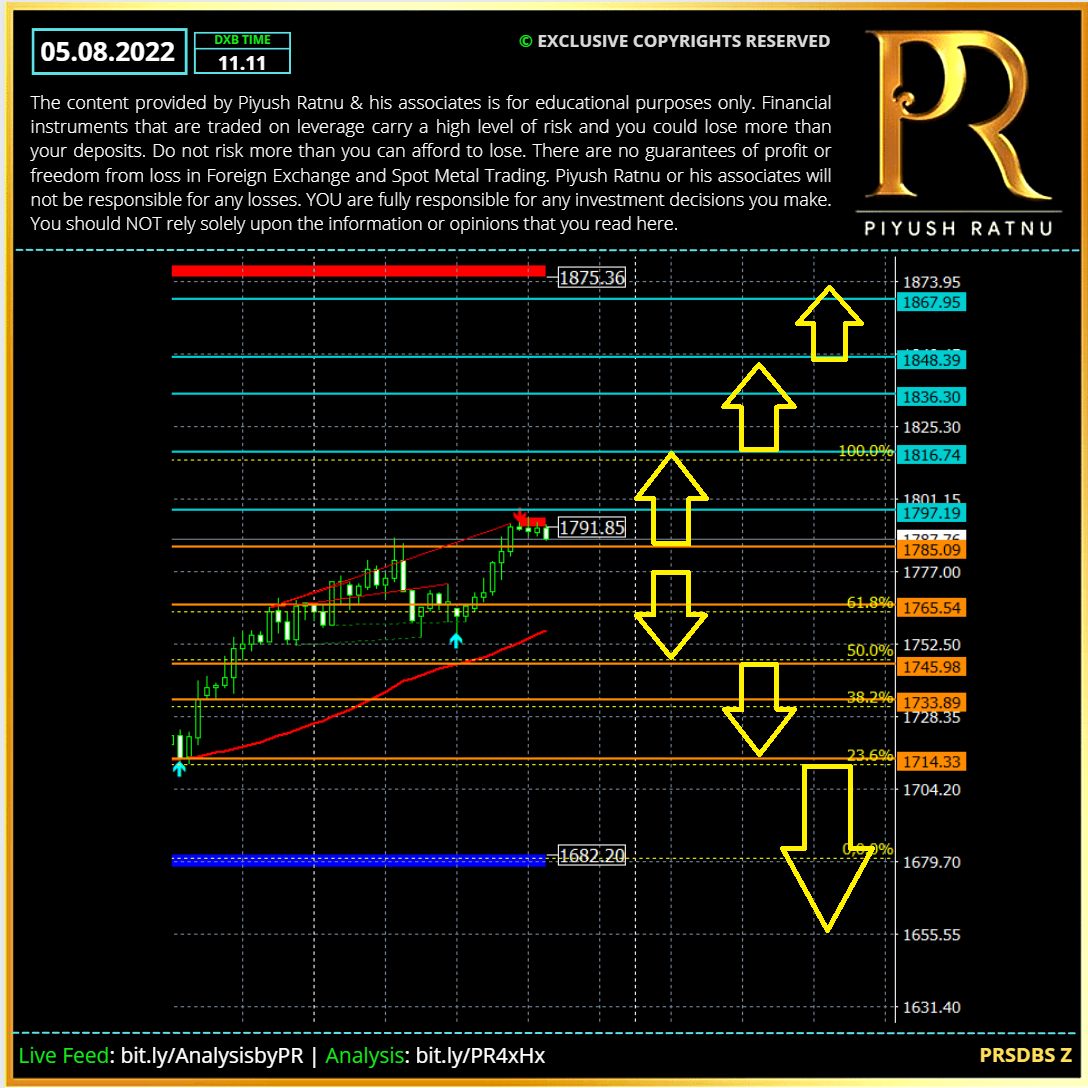
Reading Summary: XAUUSD CMP $1790
US10YT: 2.694 | XAUXAG ratio AT 88.65, XAUUSD reversed from 1685 ZONE, crossing 1777 mark as soon as DXY started crashing from 108.500 mark.
How to trade Spot Gold XAUUSD on NFP data today?
XAUUSD Bearish Scenario: $1735/1717, once again?
If the bearish momentum extends, gold price may fall further towards 1735/1717 zone (after 1760) with 1735/1717/1685 (1666 zone) as next stops, if Gold crash halts at 1717/1666 zone a reversal can be expected with a RT 23.6 on M5 and M15 30% RT before/in next 7 trading days.
XAUUSD Bullish Scenario: $1818/1866, once again?
If the Bullish momentum pushes Gold price across $1816 barrier, $1836 and $1860 (1866 zone) can be the next target for Gold, opening way to $1888 zone.
Heading into the NFP showdown today, gold price is under a price trap of 1777-1790 zone, as investors are less hesitant to place fresh bets due to ongoing less volumes based price movements. The US NFP will emerge as one of the main market driver for gold price today.
Technical Analysis | XAUUSD CMP $1790| 05.08.2022
Gold Price – Key Indicators, Factors, Price Zones & SR (D1) (W1) Levels to watch:
| SMA | |
| H1 SMA50 | 1775 |
| H1 EMA100 | 1771 |
| H1 EMA200 | 1759 |
| H4 SMA50 | 1757 |
| H4 EMA100 | 1753 |
| H4 EMA200 | 1766 |
| Daily SMA50 | 1789 |
| Daily EMA100 | 1814 |
| Daily EMA200 | 1827 |
| SR ZONES D1 | |
| R1 | 1797 |
| R2 | 1816 |
| R3 | 1836 |
| R4 | 1848 |
| R5 | 1867 |
| S1 | 1785 |
| S2 | 1765 |
| S3 | 1745 |
| S4 | 1733 |
| S5 | 1714 |
| SR ZONES W1 | |
| R1 | 1772 |
| R2 | 1794 |
| R3 | 1816 |
| R4 | 1829 |
| R5 | 1851 |
| S1 | 1759 |
| S2 | 1737 |
| S3 | 1716 |
| S4 | 1703 |
| S5 | 1681 |
PRSDBS ZONE D1 H4 BASED TRADING SCENARIOS | XAUUSD CMP $1790
TRADING STRATEGY:
- Observe price at US OPENING SS1 and then US SS2
- Observe S2/S3/S4 zone and R2-R3 zone for reversals/retracement, Target NAP
- Do not enter between the pivot zone
- Observe: FIB 23.6% on M5 and M15 TF for NAP target price
after 30/60/90/120 minutes of NFP and $25/40.60 price movement sets
Price of Focus (POF)
Crash scenario: D1
S2 – 9/12 RT NAP
S3 – 6/9 RT NAP
S4 – 3/6 RT NAP
Rise scenario: D1
R2+6/9 RT NAP
R3+3/6 RT NAP
Implement RM till 30 after 30/45/60 min. and price gap 18/24/36 after NFP
Implement GR/SM after $25/35 price movement from CMP at NFP data
Golden Ratio based money management should not be used at least till $24 price movement in any direction, if SM needs to be ignored.
Today, I will prefer to BUY session/daily lows below Support 3 and 4 zone (6/9/15 pattern) S5 crucial, and I will prefer to SELL above Resistance zones 2 and 3 (D1-6/9/15) with a target of NET average profit, if fundamentals support and favour the same.
Movement of 25/40 or 60 dollars on Gold price is not something unexpected nowadays, and a surprise on Monday during early trading hours can not be ruled out too, so closing all positions today in net average profit is always the best trading strategy for every trader who wants to safeguard his principle.
I expect V pattern in next 9 trading days. XAUUSD CMP $1790
D1 TF PRSR: BUY/SELL STOPS | BUY/SELL LIMITS: TARGET NAP200P ( Net Average Profit):
S2 ZONE 1777 | DOWN TREND (Below 1758) : 1735/1717/1666/1636 BUY LIMITS
R2 ZONE 1818| UP TREND (After 1816) : 1818/1836/1866/1888 SELL LIMITS
It is always wise to first PLAN THE TRADE, and then TRADE THE PLAN! Hence, it is suggested to first observe the crash or rise with specific zones and levels in mind on the basis of various fundamental and technical parameters mentioned above, before entering a trade in a specific direction with a target of net average profit in a specific set of trades.

