
Most Accurate Latest Forex XAUUSD Spot Gold Price Analysis Projection for next 6 months by Piyush Ratnu
♾ Key Factors responsible for soaring XAUUSD/Spot Gold Price in the first half of July, 2024:
1. US Core CPI
2. Rising Yen
3. Sinking Yields
4. Bets for September Rate cut
5. USD JPY Sell off
6. Japan’s Forex Market Intervention
7. Inflation Data
8. Dollar Sell off
9. End of week flows in Gold
10. US Elections
Gold price is on track to witness a third consecutive week of 🔺gains, sitting at its highest level since May. Despite the latest pullback Gold price remains exposed to upside risks, as a September interest rate cut by the US Federal Reserve (Fed) is almost a done deal after the softer-than-expected June US Consumer Price Index (CPI) data released on Thursday.
The US CPI climbed 3.0% YoY in June, slowing from a 3.3% increase in May and below the 3.1% expected print. Meanwhile, the annual core CPI inflation dipped to 3.3% in the same period, against the market consensus of 3.4%. On a monthly basis, CPI fell 0.1% while core CPI rose 0.1%. Both readings fell short of expectations.
Bets for a September Fed rate cut 🔺spiked to above 90% following the dismal US inflation data, according to the CME Group’s FedWatch Tool, compared to a 74% chance seen pre-CPI release. The🔻 US Dollar was slammed alongside the US Treasury bond yields, in the aftermath of the US inflation data, with the pain exacerbated by the USD/JPY sell-off.
The Japanese 🔺Yen rallied hard, as the US CPI gloom was joined by Japan’s forex market intervention, smashing USD/JPY over 300 pips in a matter of an hour. Against this backdrop, Gold price 🔺stormed through the $2,400 barrier to hit the highest level in two months.
In the day ahead, Gold price could see an extension of the corrective downside if the US Dollar recovery gathers traction.
The end-of-the-week flows could also play a pivot role in the Gold price action.
Technical Indications
The 21-day Simple Moving Average (SMA) is on the verge of crossing the 50-day SMA from below, which if realized on a daily closing basis will confirm a Bull Cross and revive the Gold price upside
According to the CME FedWatch Tool, traders are pricing a 94% chance that the Fed might cut rates a quarter of a percentage point in September.
Co – relations:
US 10YT –
USDJPY – 161.800-157.900
USD S 28
JPY S 66
AUD S 49
XAUXAG 78.30
USDCNY 7.2504
DXY 105.800-103.800
PRSRSDBS Parameters SET W1 (Validity: L 05./08.08.2024 H 24/26.07.2024/18.08.24)
R2 $2424.24
R3 $2456.96
R4 $2474.44
R5 $2502.90
S1 $2382
S2 $2354
S3 $2325
S4 $2308
S5 $ 2279
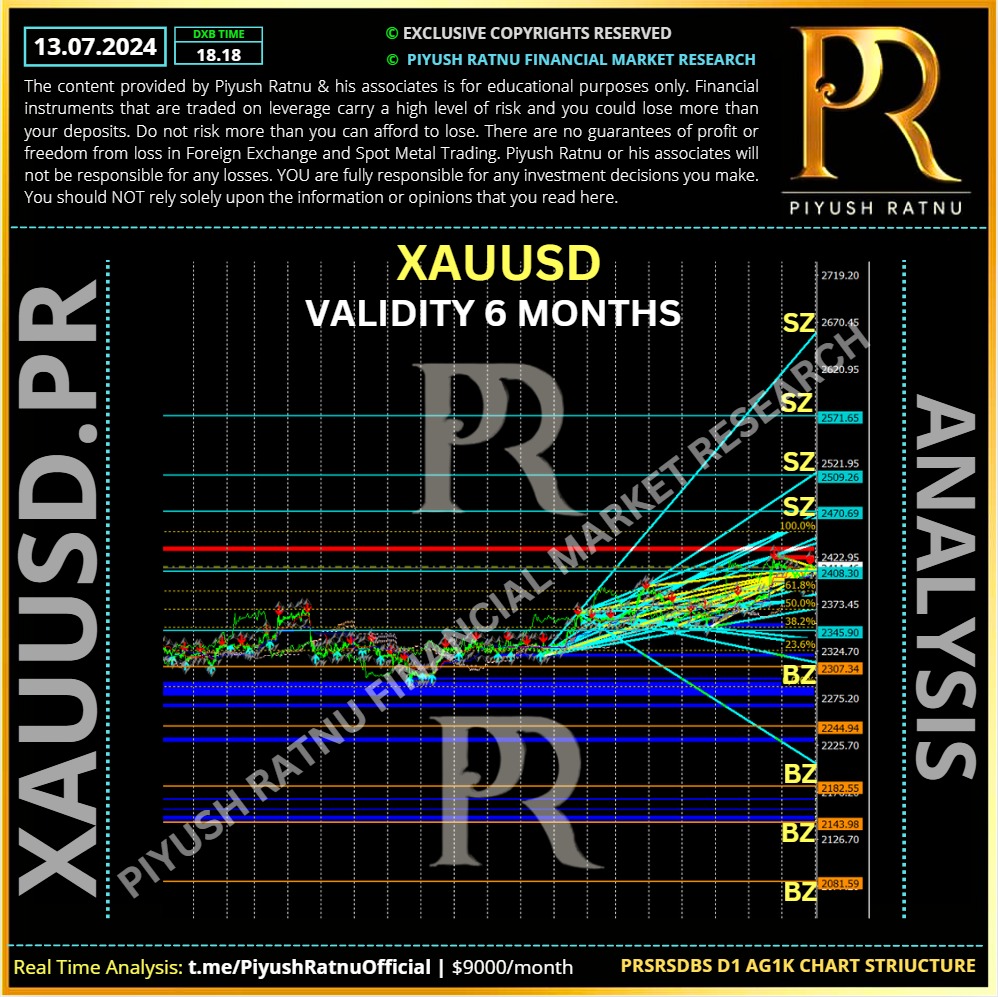
🔘PRSRSDBS Parameters SET MN
⏰ Valid for 6 Months
🟢 July W1 BZ W4 SZ
🟢Aug. W1 SZ W3 BZ
🟢Sept. W1 SZ W4 BZ
🟢Oct. W4 BZ W2 SZ
🟢Nov. W2 SZ W3 BZ
🟢Dec W2 BZ
🟢Jan W1 SZ
R3 $2415.69
R4 $2439.39
R5 $2478.78
S1 $2314
S2 $2276
S3 $2237
S4 $2213
S5 $2175
🟢Crucial Price Zone Next Week:
🔺SZ $2442/2469/2485/2505
🔻BZ $2385/2369/2342/2323
📌PRSDBS MN High Volatility based Price Projection can be checked in the image below: