Analysis: Date: 16 June, 2021
· Fed likely to steer clear of any discussion about exiting cheap money
· But it might pencil in a rate hike for 2023, lifting the dollar a little
· Gold was seen oscillating in a narrow trading band through the first half of the European session.
· Expectations for less dovish Fed – amid rising inflationary pressure – so far, has capped the upside.
· A subdued USD demand, a downtick in the US bond yields, softer risk tone extended some support.
The US economic engine is firing on most cylinders, with inflation running hot and consumption far beyond pre-pandemic levels, but the problem child is the labor market. It’s still some 7 million jobs away from its pre-crisis glory, adding credence to the view that this inflation shock will fade and making the Fed hesitant to take its foot off the money accelerator.
All this implies the Fed is unlikely to begin a discussion about exiting asset purchases at this meeting. Chairman Powell might indicate this conversation is moving closer but hasn’t started yet, preparing the market for a proper shift in the autumn. Beyond that, investors will focus on the new dot plot, where the first rate hike might be brought forward to 2023 as the economy has exceeded expectations.
That would normally argue for a stronger dollar, but any reaction may be minor as markets have already priced in two rate hikes for 2023, meaning this wouldn’t be a shocker. Overall, there’s no reason for the Fed to rock the boat right now. Inflation expectations and yields are stable or declining, and markets expect taper talks to begin in late August – so why mess with that? Any real dollar strength might have to wait until then.
Gold lacked any firm directional bias and remained confined in a narrow trading band through the first half of the European session on Wednesday. Investors now seemed reluctant to place any aggressive bets, rather preferred to wait on the side lines ahead of the highly-anticipated FOMC monetary policy decision. Investors might have started pricing in the prospects for an earlier stimulus withdrawal amid worries about rising inflationary pressure. This, in turn, was seen as a key factor that capped the upside for the non-yielding yellow metal.
That said, a combination of factors acted as a tailwind for gold and helped limit any losses, at least for the time being. Nervousness ahead of the key event risk was evident from a modest pullback in the equity markets. The prevalent cautious mood was seen as a key factor that extended some support to traditional safe-haven assets, including gold. Adding to this, a subdued US dollar demand – amid a modest downtick in the US Treasury bond yields – further held traders from placing fresh bearish bets around the dollar-denominated commodity. Gold’s next directional move remains in the hands of Fed Chair Jerome Powell and his outlook on the economy, which will influence the American central bank’s next policy action. Patchy US labor market recovery could likely challenge Fed’s tapering expectations.
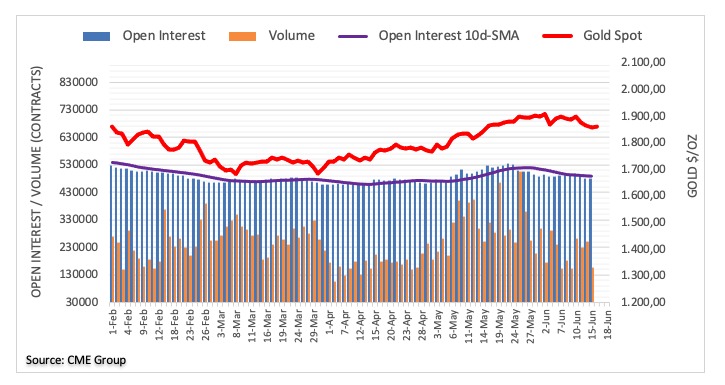
Gold prices extended the leg lower on 15 June, 2021. The downtick, however, was accompanied by declining open interest and volume, indicative that further retracements are not favoured and opening the door at the same time to a potential rebound in the very near term.
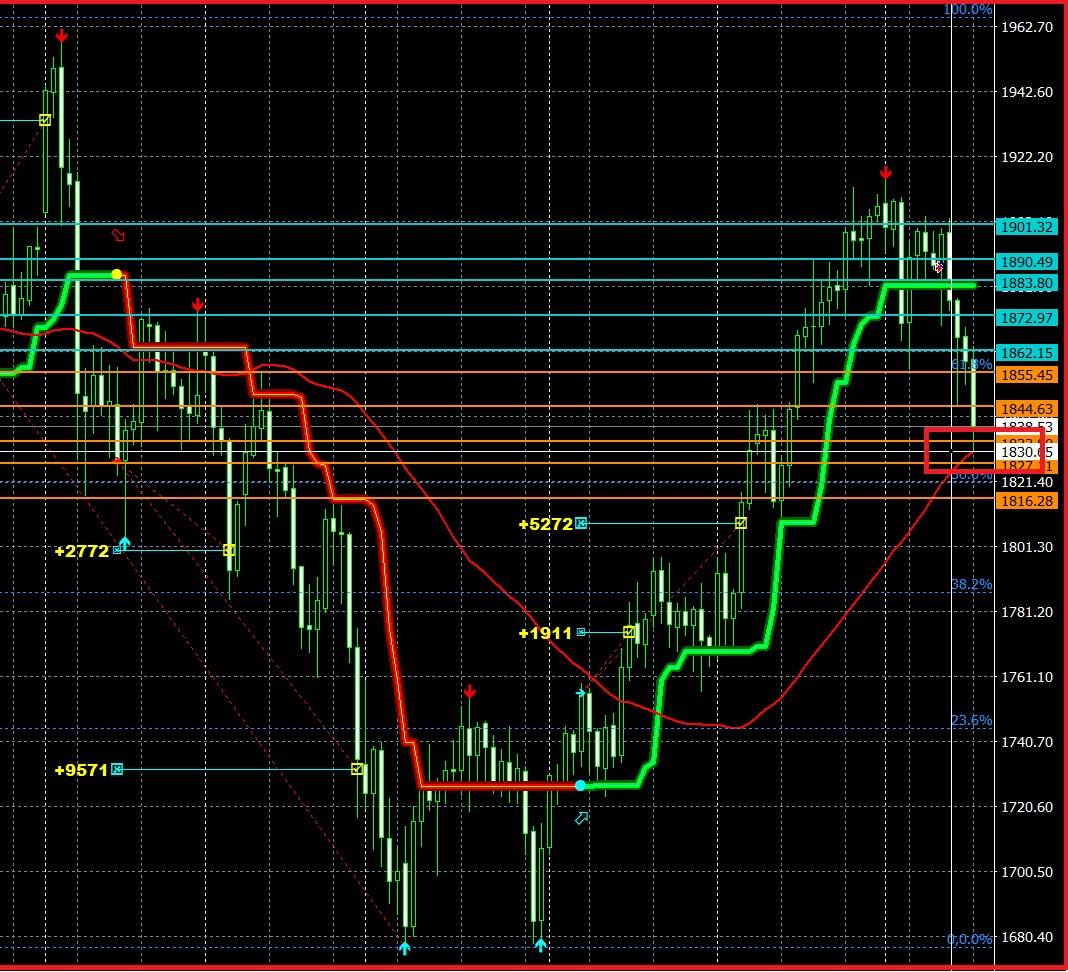
GOLD: Daily chart setup: Key observations: 1836/1830 ZONE is a tough support, unless there is a catalyst to drive the downwards rally, 1830 zone looks solid support on 16.06.2021 and a point of reversal for 25% retracement after today’s movement, before crashing further or reversing to 61.8% FIB level on today’s chart. 38.2% at 1827.00 level also makes it a solid support, in addition two support lines can be seen at 1833 – 1827 adding to the solidarity of this price range. A sell signal on Daily chart is still pending which might indicate the further crash till 1818/1777 level subject to fundamentals, tapering, interest rate project, DOT plots, XAUXAG ratio, Yields, DXY, ETF, D-S zone and Inflation concerns.
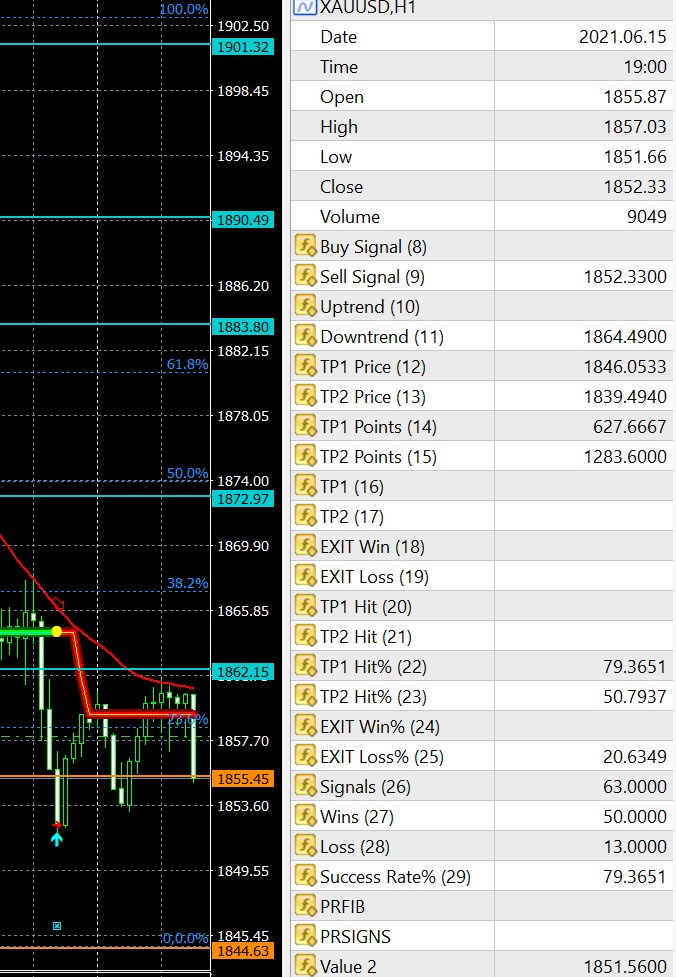
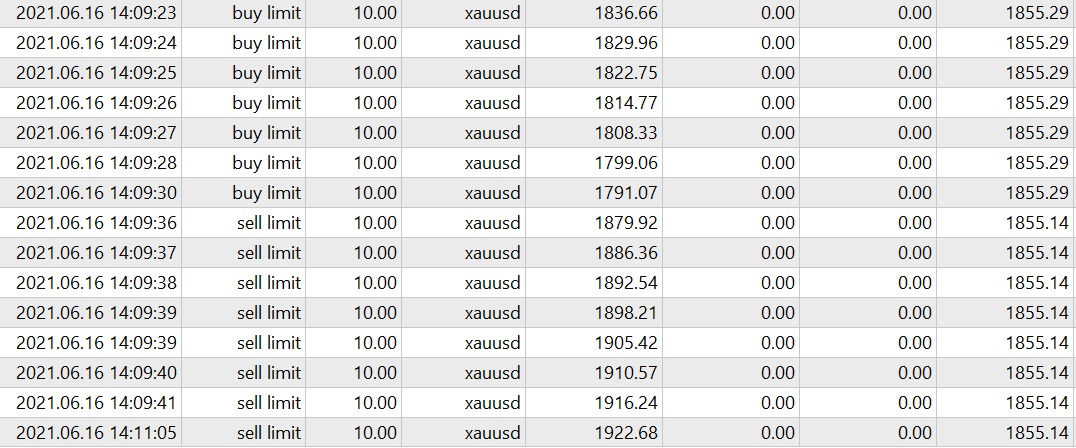
GOLD: H1 chart setup: Algorithm has already published the crashing level till 1846 and 1839 (1836 zone) yesterday based on different parameters observed in algorithm. Again this indicates, a crash till 1846/1836 level as per our 15/20/30 level price crash and reversal till 30% retracement level after the crash in the first phase. NEXT expected signal on H1 chart is BUY, so we will be BUYING Session and Daily LOWS as indicated yesterday too.
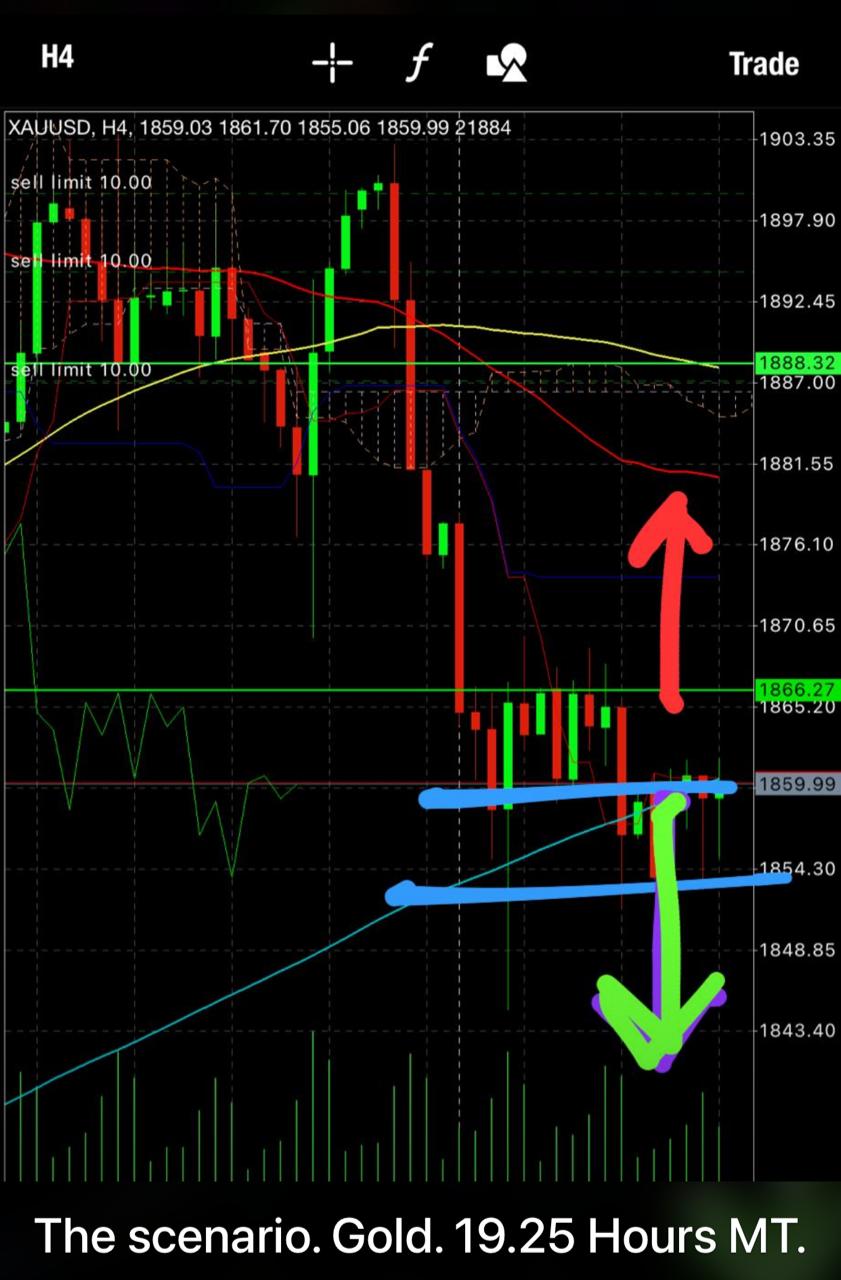
A sustained break below the rising trendline support at $1854 will validate the downside breakout, opening floors the 200-Daily Moving Average (DMA) at $1840. Next on the sellers’ radars will be the May 14 low of $1820.
Acceptance above the falling trendline resistance at $1866 will invalidate the bearish formation.
If the FOMC disappoints the hawks, gold price could rebound towards the previous daily support now resistance at $1879. Ahead of that barrier, the $1870 static resistance and bearish 21-Simple Moving Average (SMA) on the four-hour chart could challenge the bullish commitments.
SUMMARY: 1836 or 1880 zone TODAY.
Concluding:
A crash till 1836/1830 price range or a rise till 1880/1888 price range is expected, in both the cases we will first observe the movement and pattern, after the price range is achieved by GOLD we will enter in retracement keeping in mind 23.6 and 38.2% / 61.8% levels on M15 and H1 charts. In addition, SMA, trend line, existing FIB Levels, yields, DXY, USDJPY movement, Dollar strength/weakness, XAUXAG ratio – interest rate and monetary policy related statements have to be observed and analysed carefully before taking any big lot, FED and FOMC is not an event to GAMBLE, it is an important event to understand FED’s projection and further actions to set the price range and price targets for MAJORS and GOLD in correct co relation and retracement levels.
Result: 16 June, 2021
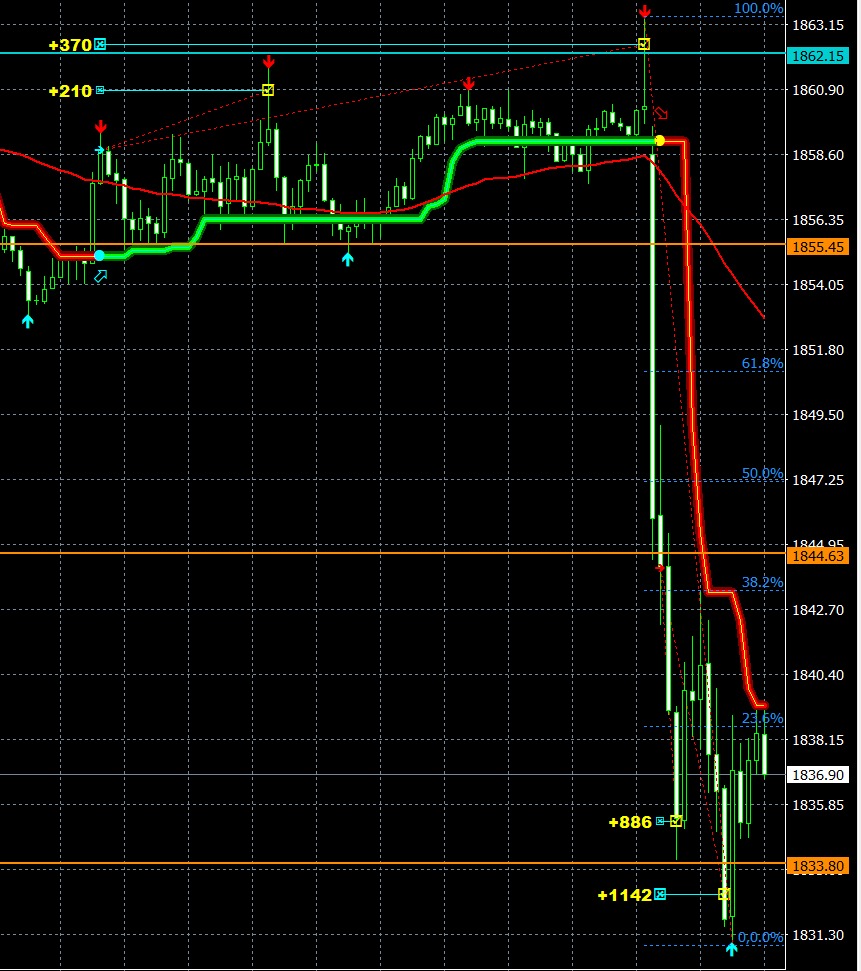
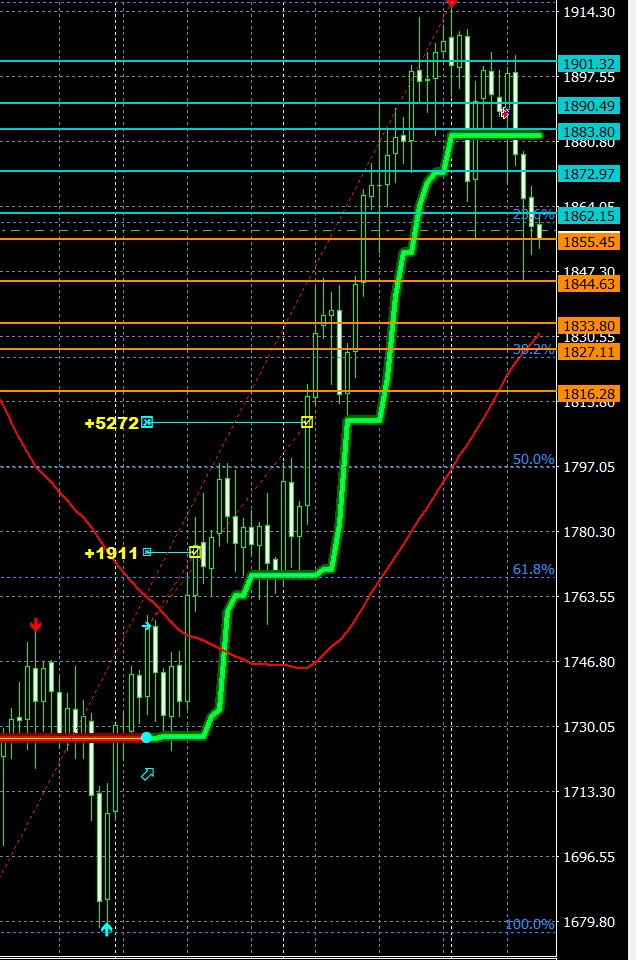
GOLD crashed till 1836 followed by 1818, 1808, 1788, 1777, 1747 price levels in next three days.
As alerted on 19.05.2021 and 12.08.2020:
- 1866 proving a tough resistance, as mentioned in analysis dated 12.08.2020 and other analysis too.
- 1966
1926
1907
1888
1866
1818
1777
1735
1717
1666 - Are strong resistance and support numbers depending on the Market direction.
- After crashing from 1907 zone Gold touched the mark of 1803 yesterday, consolidating back to the mark of 1818 zone: CMP 1823 EXITED BUY.
Duration: 23 May-17 June 2021
Investors drove the U.S. dollar sharply higher on Wednesday after the Federal Reserve signaled an earlier interest rate hike. Thirteen out of 18 policy-makers now see as many as two rate hikes by the end of 2023. In March, only seven members saw a move in 2023, with the majority looking for rates to remain unchanged into 2024. This dramatic shift in expectations was motivated by stronger-than-expected growth and inflation. The improvements in the U.S. economy have clearly convinced policy-makers that “inflation could turn out to be higher and more persistent than we expect,” according to Federal Reserve Chairman Jerome Powell. Growth and inflation forecasts were raised for 2021 and 2023. The most dramatic change was in their estimates for core PCE, which was raised by a full percentage point to 3.4% for 2021.
Powell’s tone at the press conference was undeniably optimistic. He said indicators of activity and employment continue to improve, with the factors weighing on employment growth expected to wane in the coming months. He took time to downplay the slow improvements in the labor market, saying that it is clear we’re on a path to a very strong labor market one to two years out. As a result, “many participants are more comfortable” with the idea that “economic conditions” in their “forward guidance will be met somewhat sooner than previously anticipated.”
Powell even addressed taper. The Fed chair admitted that officials have begun “talking about talking about” slowing bond purchases even though tapering won’t happen until they “feel the economy has reached substantial progress.” “They’ll be able to say more about timing when they see” the data. Ten-year Treasury yields jumped 5%, reinforcing the rally in the U.S. dollar.
The question now is whether the U.S. dollar’s gains are sustainable. Given how long investors have been waiting for the central bank to talk taper and how uncertain it was as to whether it would happen today, we see further gains in the U.S. dollar. The Fed’s optimism is a reflection of its belief that economic data will continue to improve in the coming months. The Swiss Franc was hit the hardest by the rally in the U.S. dollar followed by the euro. The European Central Bank avoided taper talk at its last meeting and that decision weighed heavily on EUR/USD’s performance on Wednesday. The Swiss National Bank meets tomorrow and, like the ECB, no consequential changes are expected.
Next to the Japanese Yen, the currency that resisted the U.S. dollar’s rise the most was sterling. Inflation in the UK rose more than expected in the month of May, as the year-over-year CPI rate hit 2.1%. The Australian and New Zealand dollars come into focus tonight, with Q1 GDP due from New Zealand and labor market numbers expected from Australia. Both reports are expected to be strong, which should ease some of AUD and NZD’s losses.
For more detailed analysis before economic event, for live trading feed connect with us at info@piyushratnu.com
