Non-Farm Payrolls numbers are all set to be released today. Let us first understand the Co-relation between NFP and XAUUSD:
The strongest negative correlation is seen 15-30 minutes after the release. One hour after the release, strong reversal or extension of trend and price movement might be observed on NYSE opening. Higher retracement/trend expansion from the CMP at the time of NFP data release can be observed until next four hours after the release with retrace target of 23.6 Fibonacci retracement on M1, M5 and M15 charts in sequence.
Further, on next Monday opening trend might extend or retrace depending on multiple factors like market sentiments, additional data, statement, CPI expectations (to be released next week for many countries), hence exiting the trades today itself in net profit is always a wise idea.
Current Scenario:
Gold price staged an impressive bounce from four-week lows of $1,770 on Wednesday to reach as high as $1,809 before reversing sharply to finish the day at $1,779. The up and down price movement extended into gold trading so far this week, as volatility returned on the back of the uncertainty surrounding the Omicron covid variant and Fed Chair Jerome Powell’s hawkish shift on the monetary policy normalization.
On a global scale, central banks’ interest in gold is picking up this year. Earlier this week, markets digested the news that the central bank of Singapore increased its gold reserves by 20% this year, buying gold for the first time in two decades. This boosted Singapore’s total gold reserves to a reported 153.76 tons.
The Irish central bank is adding gold to its reserves after a 12-year hiatus, and inflation worries. Overall, global gold reserves rose by 333.2 tons during the first half of the year, according to the data provided by the World Gold Council. Other notable purchasers were Thailand, Brazil and Hungary.
Will banks buy a sinking Gold, a question that comes in my mind.
Core key factors that are impacting Gold since last 10 days:
A faster wind-down of the bond-buying program is widely seen as opening the door to earlier interest rates hikes, which would raise the opportunity cost of holding non-yielding gold.
In his second day of testimony in Congress on Wednesday, Powell said the Fed needed to be ready to respond to the possibility that inflation might not recede in the second half of 2022 and the central bank would consider a faster tapering of its bond purchases at its meeting this month.
Gold plumbed a one-month low on Thursday as U.S. Federal Reserve Chairman Jerome Powell’s comments on the need to tame inflation bolstered bets for faster monetary policy tightening and offset Omicron-driven safe-haven inflows into bullion.
U.S. Treasury Secretary Janet Yellen said on Thursday that lowering Trump-era tariffs on imported goods from China through a revived exclusion process could help ease some inflationary pressures, but would be no “game-changer”.
Political risks associated with the pending U.S. mid-term elections, U.S. fiscal drag, fairly steadfast central banks gold purchases, and a significantly slower pace of U.S. and global recovery are additional factors which may see investor rekindle their interest in gold very soon.
Real interest rate trends which were driven by inflation developments, Fed policy signals, and nominal rates, led to these gold price fluctuations. For most of 2021, investor ETF, CTA, and derivatives positioning were very much skewed toward the shortening of exposure
Considering this framework and the fact that the market is pricing a Fed funds hike as early as next summer, the current investor bias toward the short end of exposure has driven prices down to $1,755 recently. But summer of 2022 may be much too early for the Fed to pull the trigger on Fed Funds hikes, given the fact that nonfarm payrolls remain some 4-5 million below pre-Covid levels in the U.S.
Fundamental Summary:
Rising home prices are good indications that sustained inflation across the board is rearing its ugly head. If people expect goods price inflation to rise and remain high in the future, they will adjust their wage, rental and credit agreements.
Owners of assets, which increase in price, benefit while the holders of money suffer: They can buy fewer assets for their money
The idea that the Fed is closer to a rate hike is dampening the demand for the non-yielding inflation hedge that is the yellow metal. Strong jobs on Friday could be the nail in the coffin for gold and support the greenback higher in anticipation of a faster rate of tapering from the Fed.
The hope for the resulting higher potential growth, non-accelerating inflation rate of unemployment, may all leave the U.S. central bank comfortable keeping the economy running hot for longer. This would be a very gold-accretive real interest rate environment. The best case for gold is high but decelerating inflation.
Technical Summary:
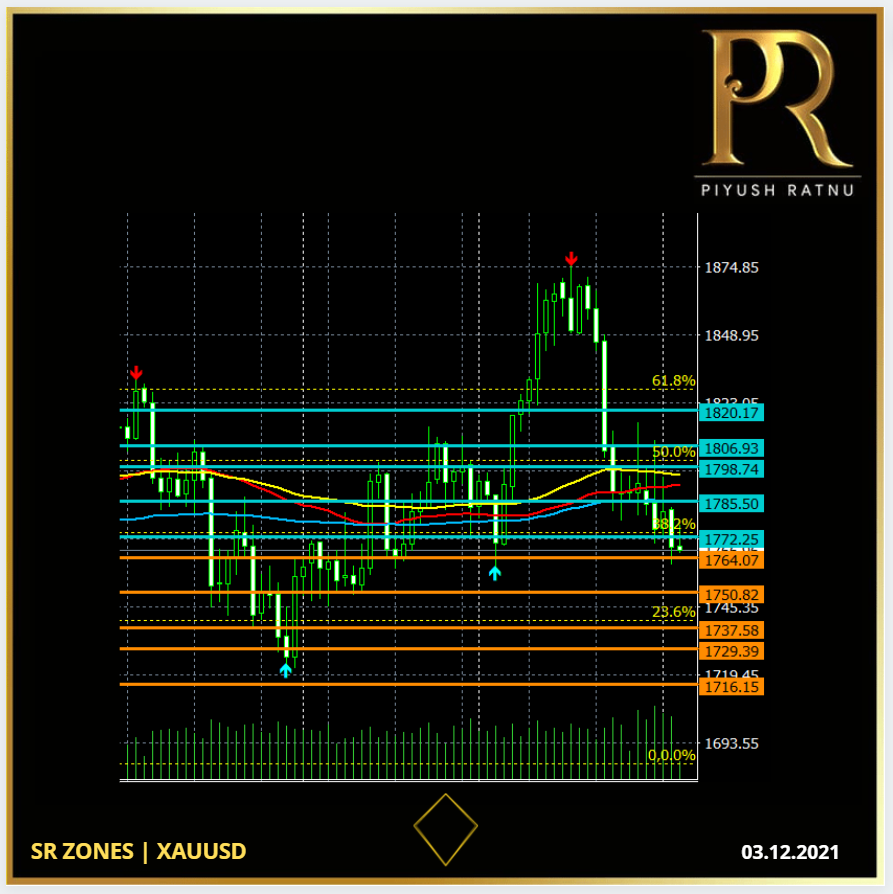
Multiple times Gold price got rejected at 1808 and 1796 zone. 1777 acting as tough support. A crash below 1777 will trigger price to 1745/1717/1685 zones. However a reversal from 1777 can trigger the price to 1796/1808/1818/1832 stops in sequence. NFP will prove as a game changer for Gold price in the first and second week of December 2021.
Support at:
$1764
$1750-$1737 ($1745 zone)
$1729-$1716 ($1717 zone)
$1666 zone ahead
Resistance at:
$1772
$1785 – $1798 ($1796 zone)
$1806 – $1820 ($1818 zone)
$ 1832 zone ahead
SMA 50
H1: $1777
H4: $1787
D1: $1792
W1: $1800
SOC 1555 SET
H1: Marching Towards OB zone
H4: OS zone
D1: OS zone
W1: Near OB zone
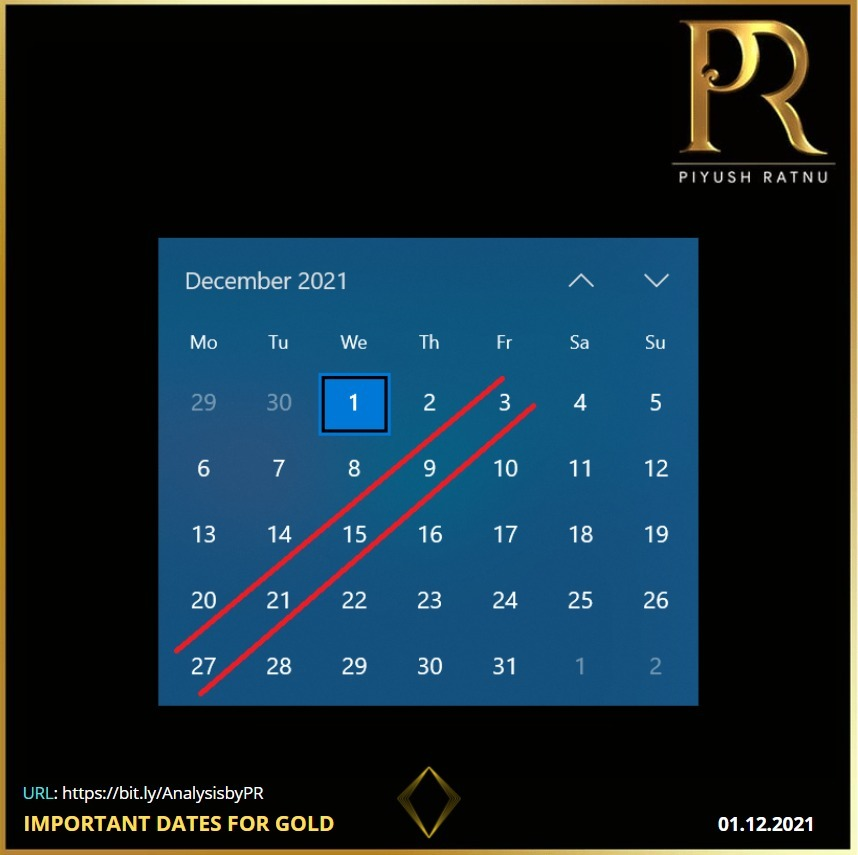
IMPORTANT DATES FOR GOLD TRADERS:
03.12.2021: NFP
14/15.12 : FOMC | STATEMENTS
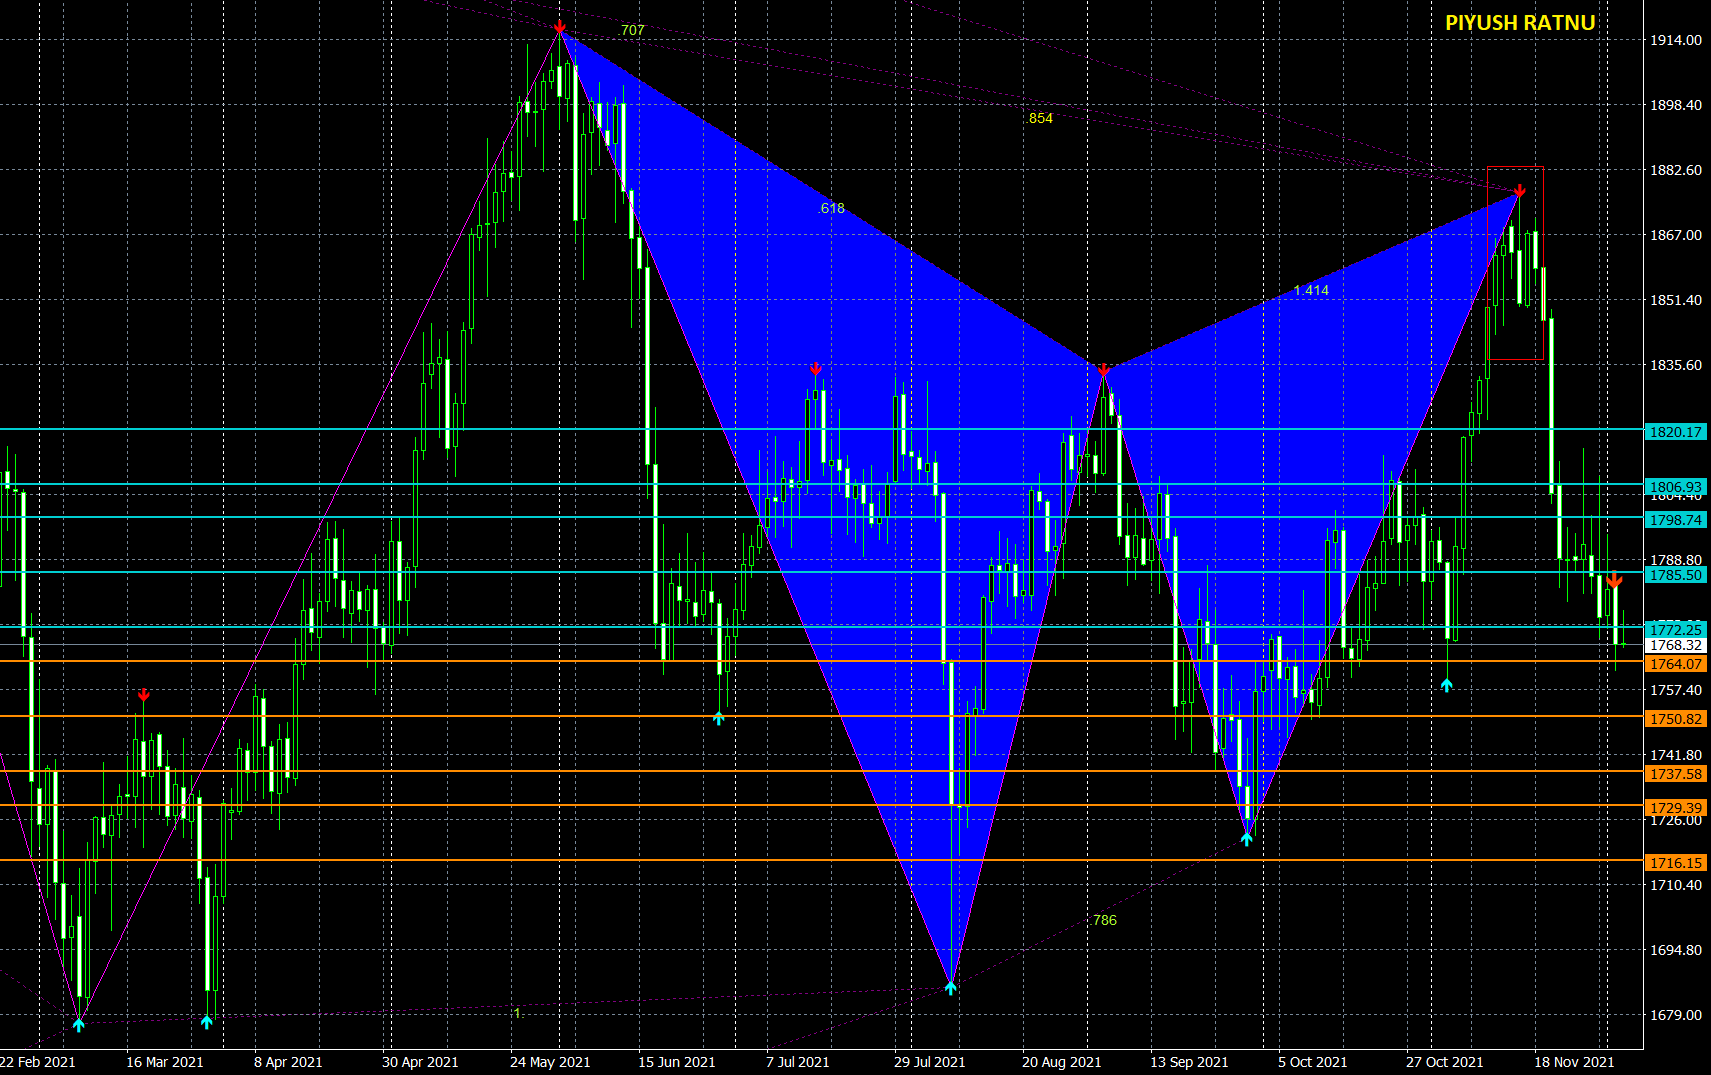
GARLEY PATTERN SCANNER:
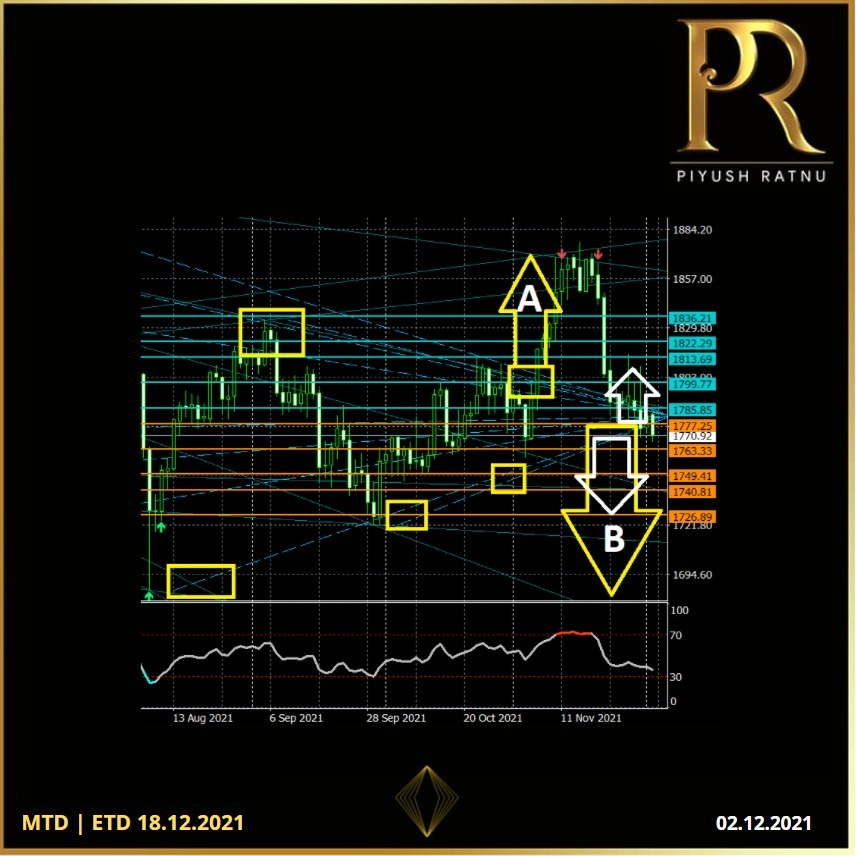
Possible scenario on the basis of GPS:
A: crash can extend till $1729-$1717 zone
B: rise might extend till $1796/$1818 zone.
MULTI-DIAGONALS + SR zones + FRACTALS
Possible scenarios:
A: Crash Stops: $1737 – $1717 – $1685
B: Rise Stops: $1796 – $1808 – $1818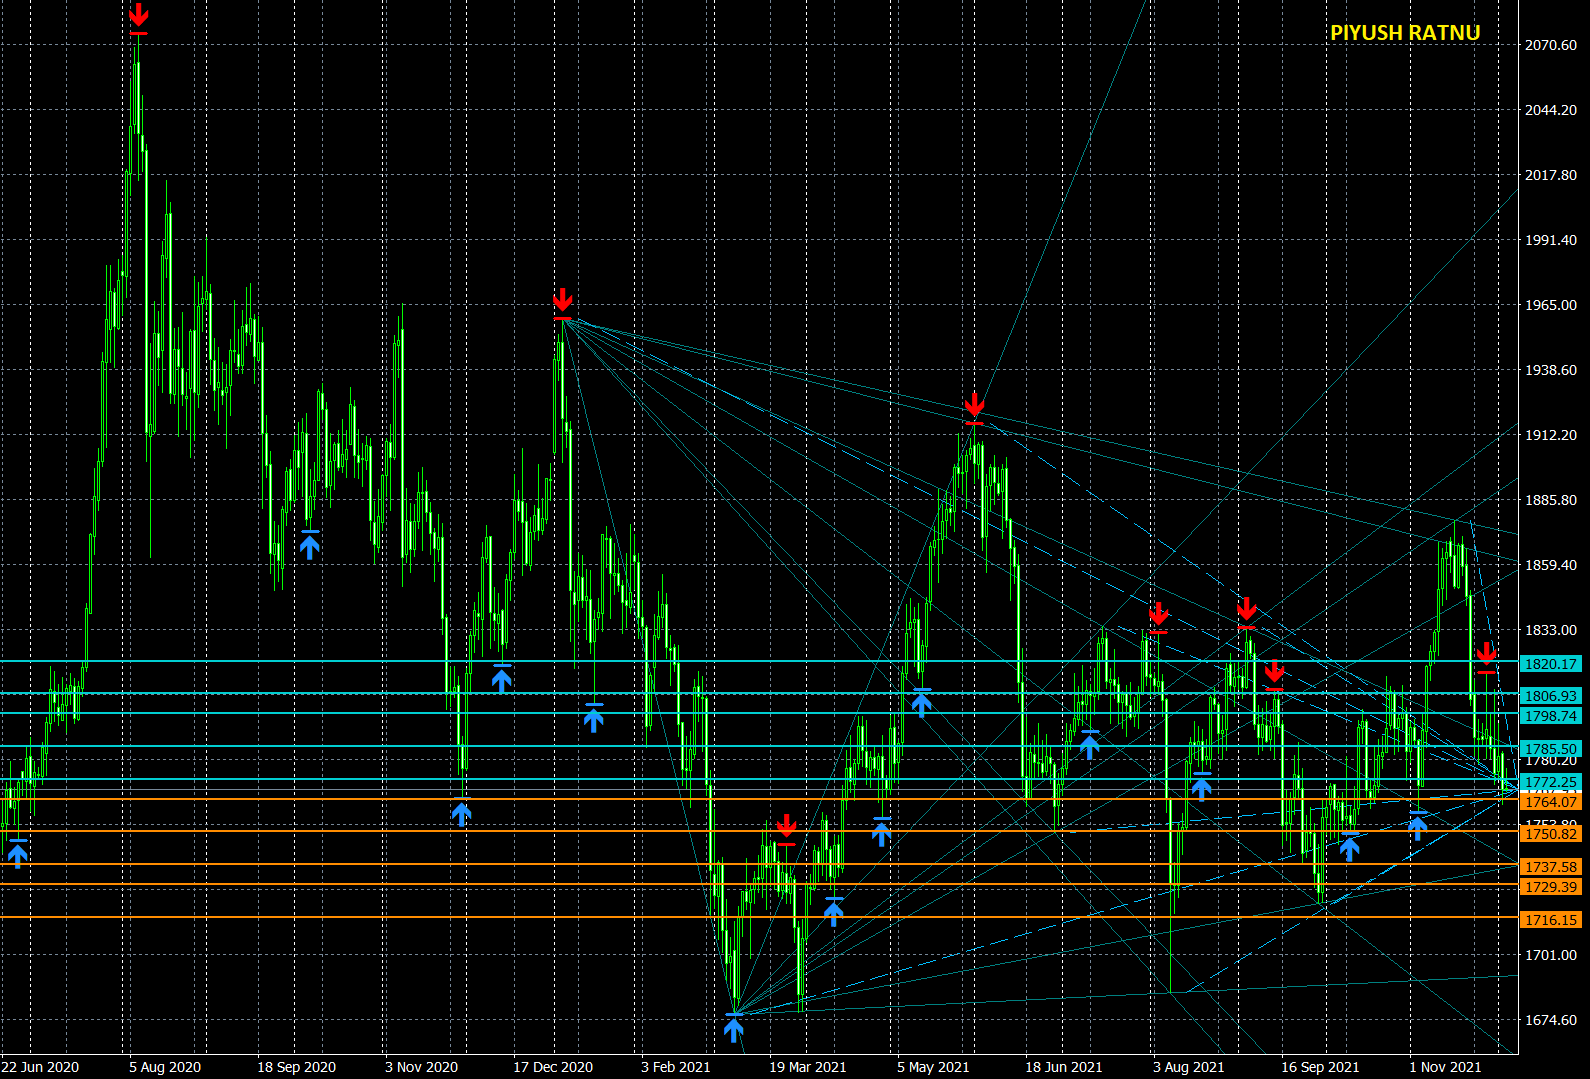
POSSIBILITIES OF GOLDEN CROSS:
Gold’s daily chart is hinting at a potential reversal in the ongoing downtrend, with the 50-Daily Moving Average (DMA) having crossed the 200-DMA from below. A golden cross will be confirmed if the above averages maintain the formation on a daily closing basis.
What is a Golden Cross:
The golden cross occurs when a short-term moving average crosses over a major long-term moving average to the upside and is interpreted by analysts and traders as signalling a definitive upward turn in a market. Basically, the short-term average trends up faster than the long-term average, until they cross.
Technical Analysis Summary:
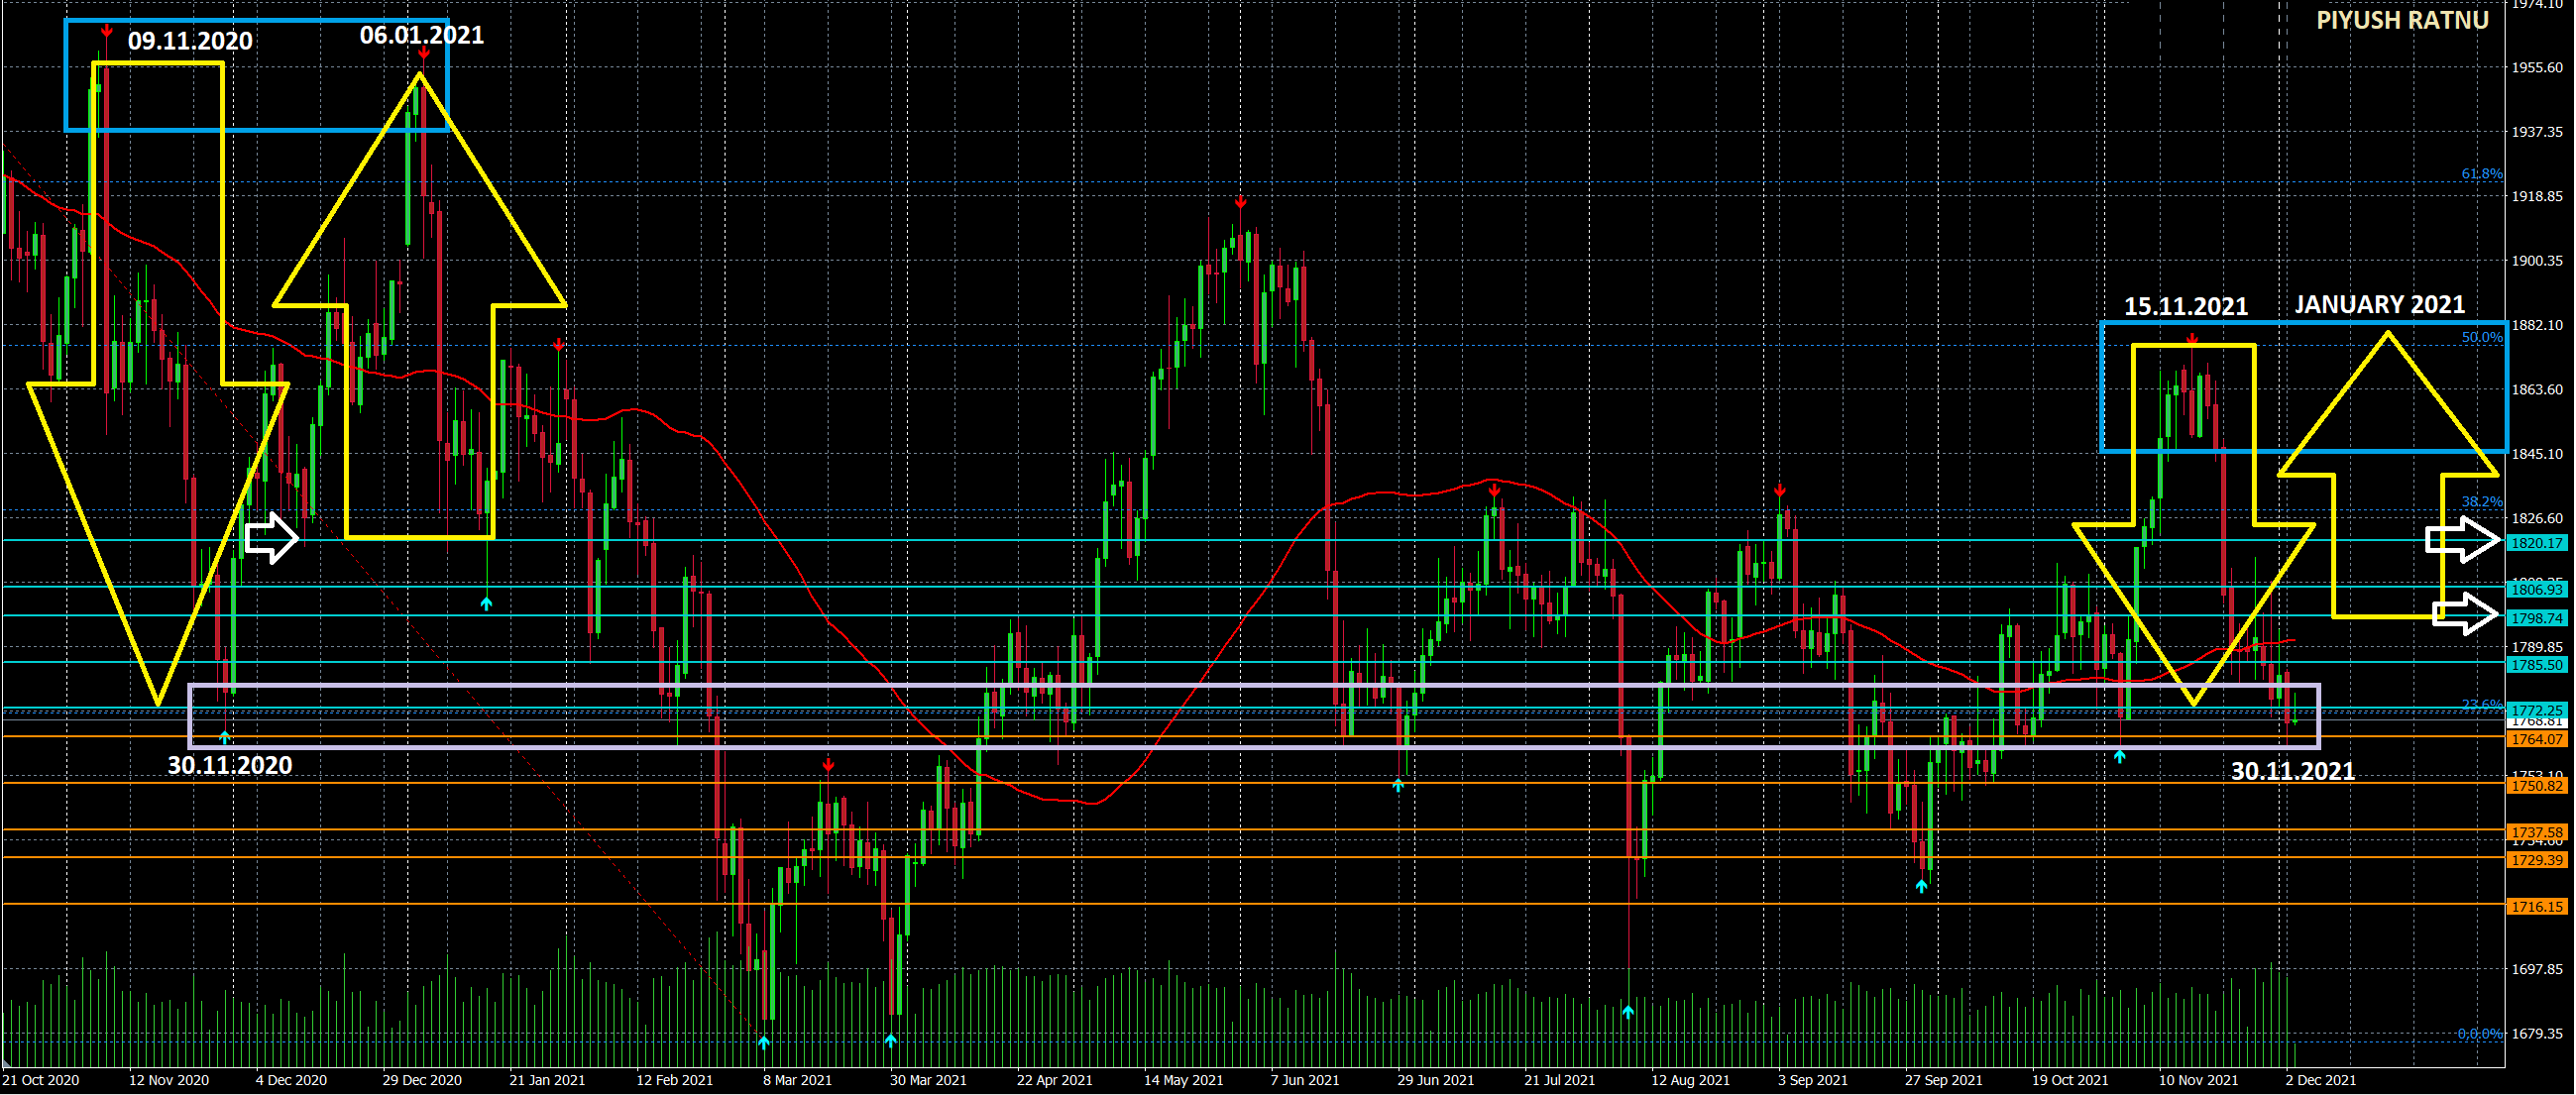
As per my analysis dated 02.12.2021 (mentioned below as image), I see the crash and rise in the following patterns, a retracement at Support/Resistance zones before further crash or rise is quite likely, as observed in last few months. 18 December, 2021 is the expected date of the achievement of the targets mentioned in the figure below.
Repetition of November 2020 patterns, likely?
From the technical point of view if we analyse and check the price movement last year during November, 2020 as compared to November 2021, there is quite a similarity between both till now with a gap of 4 days to be precise. In my earlier analysis I had mentioned the high possibilities of crash in first and second week of November 2021, followed by reversal/rise in first-second week of December 2021 as per the past data mapping of last 6 years. Last year I had published in my analysis 16 December, 2020 as a date from which Gold might start rising and Gold did rise till the price above $1955 till 06 January, 2021 before crashing further from this price point.
Before we all get overconfident, let us not forget as unexpected as it sounds, but Gold had dropped to earth-shattering levels after the US NFP data published on 06 August & 09 August 2021 which proved to be a lot stronger than expected. The price crash was observed from $1832 (ADP) to $1684 (09 August, 2021). As a result, the precious metal again repeated its history by crashing on 9th August 2021, repeating a similar pattern acknowledging its 2020’s $150+ fall on 8th August well announced in advance by me.
In the same pattern, I won’t be surprised if a repetition is formed this December, 2021 – January, 2022 too. As I had mentioned earlier price patterns on specific dates remained same multiple times unless triggered by fundamentals or geo-political tensions. It will be worth observing the price movement and SR zones based price action this NFP.
It is always wise to PLAN THE TRADE, and then TRADE THE PLAN! Hence it is suggested to first observe the crash or rise with specific zones and levels in mind on the basis of various fundamental and technical parameters, before entering a trade in a specific direction with a target of net average profit.
I wish you all the best for today & everyday!


